
We’re happy to share some of Opster’s highlights from the first quarter of 2023 and some of our upcoming features that will be released soon.
In Q1 we introduced tons of exciting new functionalities that help our customers and answer their needs. If you want to try them out for yourself, you can start a free trial here.
Here’s a few of the most exciting features we added:
- Q1-2023 Feature Highlights:
- Easily detect and track cost saving opportunities with AutoOps
- Tune your event notifications to your exact needs using EventMute and AutoMute
- Connect new clusters to AutoOps quickly & easily with the new Metricbeat installation process
- No need to run the Template Optimizer manually – AutoOps will do it automatically for you
- Get deeper visibility into your resources, stability and performance with the new Reports dashboard
- Benefit from additional security, easier quick actions and more in the newest OMC version
- Coming soon:
- Here’s to another great quarter!
Q1-2023 Feature Highlights
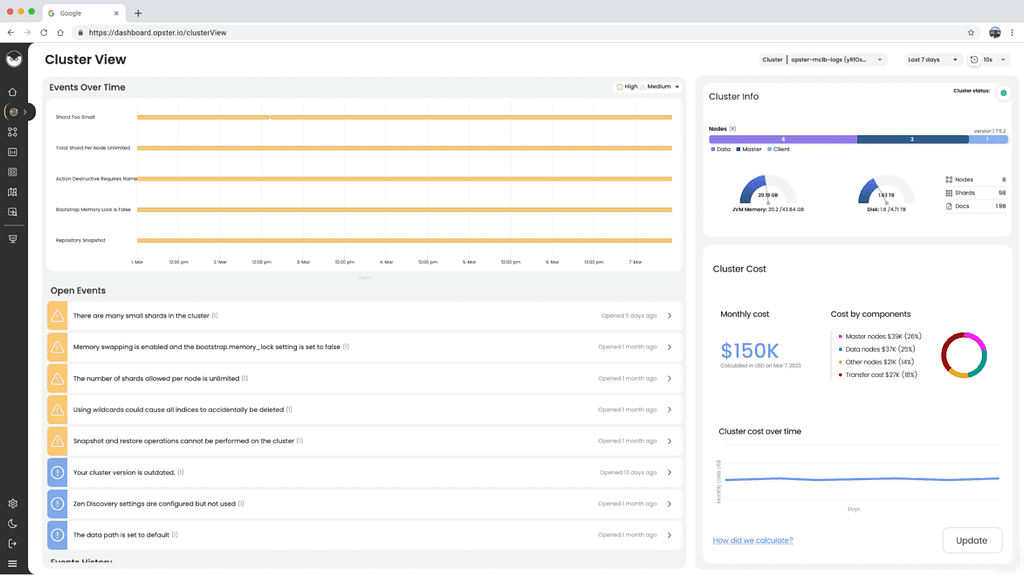
Easily detect and track cost saving opportunities with AutoOps
This quarter we released the next generation of cost saving features in AutoOps!
First, we added enhanced cost visibility over time for both Elasticsearch and OpenSearch clusters. New graphs and monitoring abilities have been added to AutoOps that make it super easy to detect and track cost-related changes.
You can get notifications when costs are on the rise, and see a breakdown of your expenses by different components and resources in your cluster/s. We also added new reports that track cost-related metrics over long periods of time.
Second, we added enhanced cost saving optimizations. AutoOps identifies all potential areas where you can reduce your costs by making slight changes and optimizations. Each potential cost saving opportunity is displayed in a dedicated event. Every event includes: how much can potentially be saved, what the optimization is related to, and actionable recommendations on how to perform the changes.
AutoOps now monitors, summarizes and aggregates all potential savings, so that within the cost visibility dashboards you can easily see how much you can save by implementing the recommendations provided.
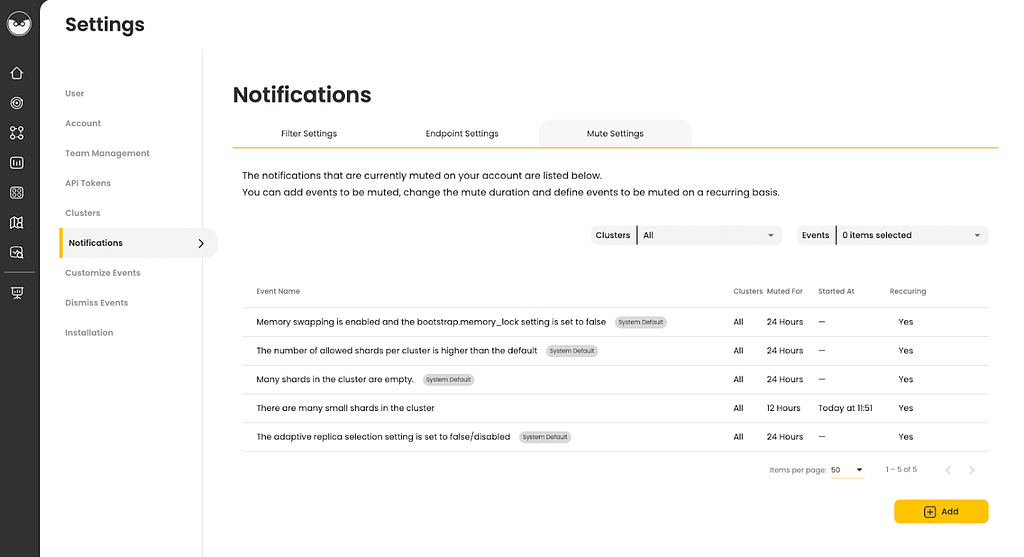
Tune your event notifications to your exact needs using EventMute and AutoMute
EventMute and AutoMute are two new features allowing customers to take advantage of AutoOps’ advanced notification capabilities. Users can now tune event notifications so as not to be notified about specific events as desired, and set the desired duration for the mute.
By adjusting the notifications, customers can now ensure that they quickly see the issues which they care about the most and eliminate alerts which aren’t necessary to their operation.
For example, users can define that if a certain event frequently opens and closes without posing a risk to cluster performance, they will get a single notification per day regarding it. This configuration can be one-time or recurring.
Additionally, we introduced a new notification status bar, clearly indicating whether a notification was sent, muted, or delayed and to which endpoint the notification was sent. Users can use the default settings or define new settings for both of these features.
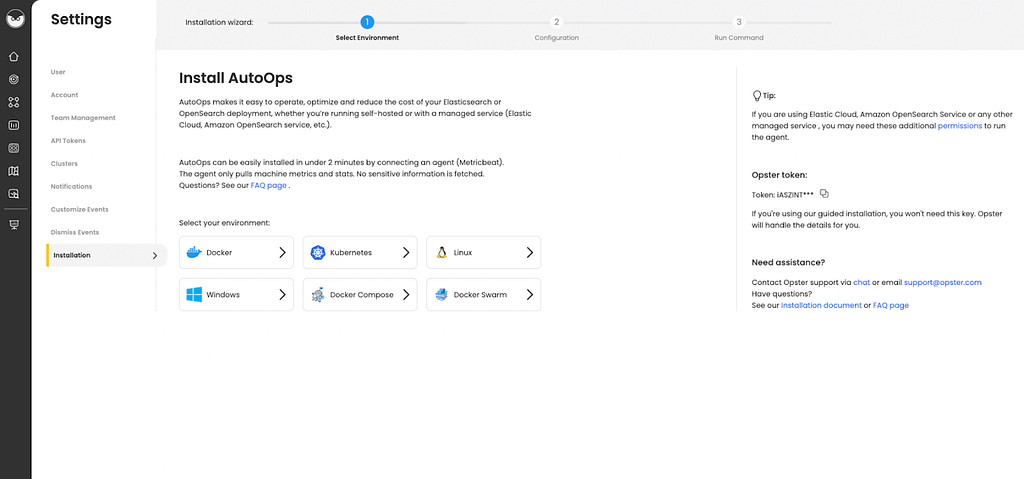
Connect new clusters to AutoOps quickly & easily with the new Metricbeat installation process
It’s easier than ever to connect clusters to AutoOps with the new Metricbeat installation flow we rolled out in Q1. You can now customize and generate a single installation command using a guided installation wizard and connect a cluster in under 3 minutes.
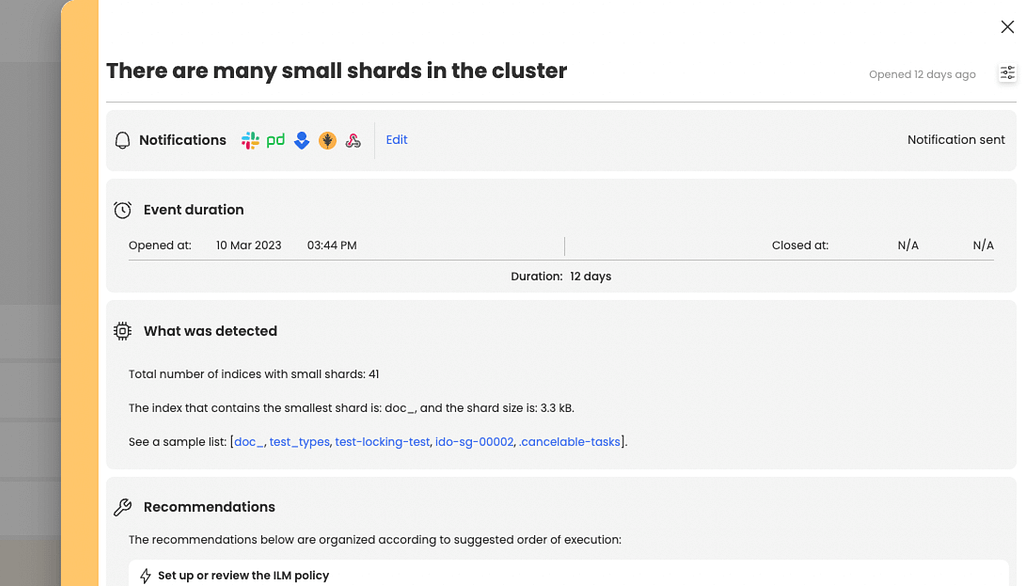
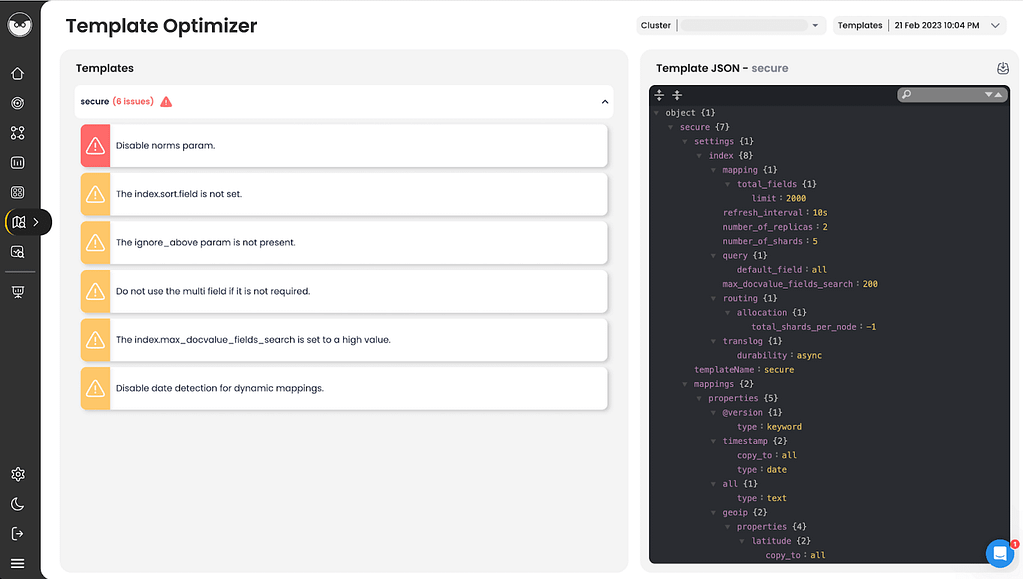
No need to run the Template Optimizer manually – AutoOps will do it automatically for you
You don’t have to run the Template Optimizer manually anymore – AutoOps does it automatically. We’ve added an event to track the creation of new templates, as well as events to show changes in existing templates that may require your attention. AutoOps will analyze all the templates to identify fields that need to be adjusted in order to improve performance, and a report is compiled and made available to users automatically.
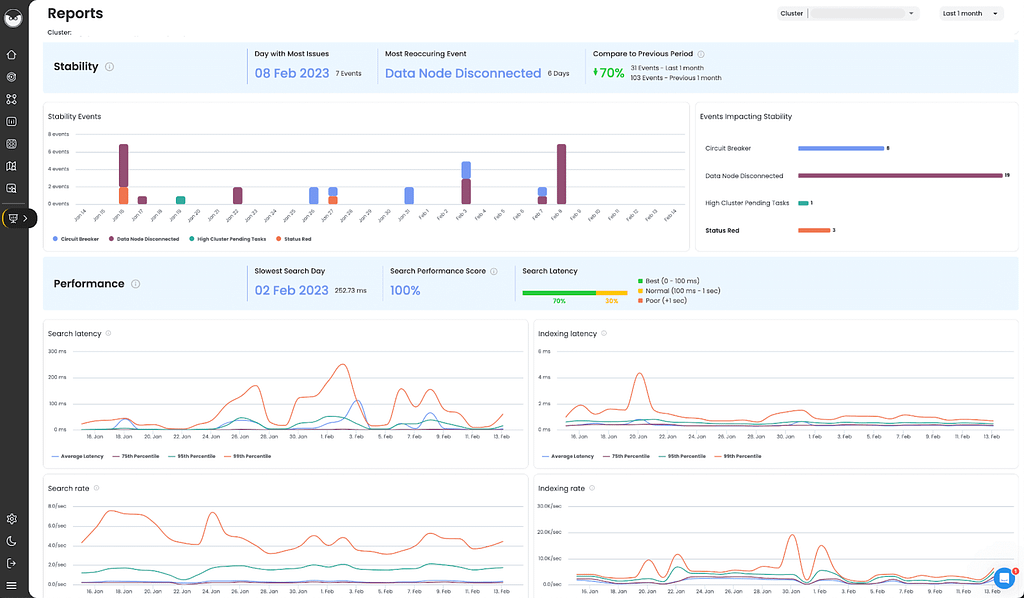
Get deeper visibility into your resources, stability and performance with the new Reports dashboard
We redesigned and reorganized the Reports tab in AutoOps to provide even better visibility of your clusters. There are new reports available and specific KPIs for each of the categories: resources, stability, performance.
Check out the new graphs portraying:
- Indexing rate
- Search rate
- A breakdown of stability events
- Operating system memory
The new KPIs we’ve added show changes over time for:
- Resources – the total number of nodes, documents, shards and memory usage.
- Stability – which day had the most issues, which events recurred the most, and comparisons to previous desired time periods.
- Performance – which day had the slowest search performance, search latency measurements and search performance score.
Benefit from additional security, easier quick actions and more in the newest OMC version
OMC provides users with amazing orchestration and management capabilities, completely for free.
In this new version, we’ve added additional features that will make a big difference for users:
- Security configuration – easily define OpenSearch security measures, such as user roles, credentials, etc.
- Admin credentials – change admin passwords automatically.
- Quick actions – automatically scale nodes and resources up and down.
- Draining of nodes – move data away from nodes prior to scaling down automatically.
- Init helpers – override default images that run before the service starts for customization.
- And more!
You can install the OMC for free here.
Coming soon:
Easily view and sort clusters by desired environments and regions
We’re adding the ability to define groups of clusters based on your desired denominators and sort your dashboards based on these groups. For instance, you can define groups for dev, staging and production, or groups by different regions, and any other common denominator you’d like.
View events sorted by different aspects
We’re adding the ability to group events in buckets based on different attributes, such as workload, impact, search-related events, shard-related, resource-related and more. You can also define your own buckets for events. This will make it easier to view the issues that are the highest priority for your own use case and quickly resolve what requires your attention the most.
Additional cost saving elements
We’re adding many additional cost-saving rules and reports. The primary addition will be long-term views of cost-saving opportunities in reports, going back years, so you can get the most accurate picture possible of your cost over time and where you can save.
Here’s to another great quarter!
As always, there’s more coming soon, so stay tuned.
Want to start using AutoOps? You can sign up for a free trial here, or contact us here!
Want to start using the OMC for free? Check it out here.