
What slow logs are used for
The length of time a query takes to execute is often a good indicator of which queries need to be optimized in your Elasticsearch cluster.
Elasticsearch provides the possibility to create a log output of all search and index queries that take longer than a certain specified amount of time to execute. This output is called “slow logs”. By correctly analyzing your slow logs you can understand why searches are slow and how to optimize them.
How to set up slow logging
Follow the step-by-step instructions in this video to set up slow logging and generate your slow logs file:
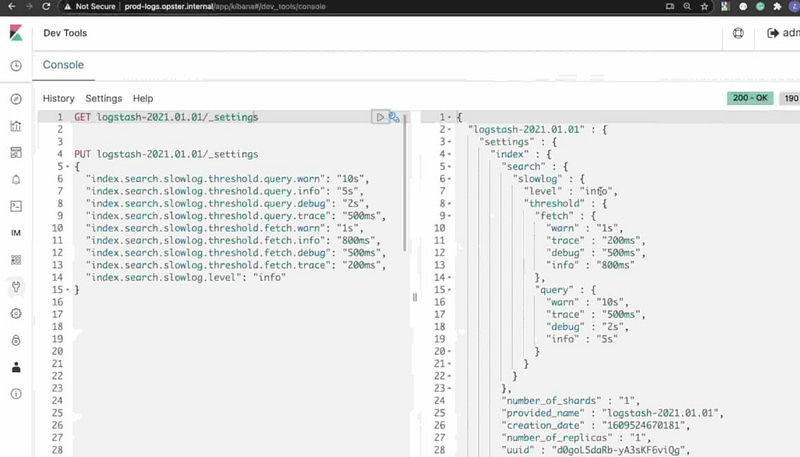
You can setup logging dynamically by running the following commands:
For search logging
PUT /my-index-000001/_settings
{
  "index.search.slowlog.threshold.query.warn": "10s",
  "index.search.slowlog.threshold.query.info": "5s",
  "index.search.slowlog.threshold.query.debug": "2s",
  "index.search.slowlog.threshold.query.trace": "500ms",
  "index.search.slowlog.threshold.fetch.warn": "1s",
  "index.search.slowlog.threshold.fetch.info": "800ms",
  "index.search.slowlog.threshold.fetch.debug": "500ms",
  "index.search.slowlog.threshold.fetch.trace": "200ms",
  "index.search.slowlog.level": "info"
}
Notes:
The setting is at index level, so you can apply to specific indices, groups of indices (using *).
Note that there are two phases, “fetch” and “query”. The “query” phase refers to the time taken to obtain a list of documents from all the shards involved in the search, while the “fetch” phase refers to the time taken to obtain the actual source documents to return as a result.
Lastly, although you can define different logging levels independently, logs will only be sent to file according to what you define in the slowlog.level to be applied.
If you wanted to see all the queries being processed, you can set the following:
PUT /my-index-000001/_settings
{

  "index.search.slowlog.threshold.query.trace": "0ms",
  "index.search.slowlog.threshold.fetch.trace": "0ms",
  "index.search.slowlog.level": "trace"
}
Remember! Intensive logging of queries should only be applied during development or for very limited time for sampling purposes in production.
For indexing logging
Please note the below is for indexing not for search logging
PUT /my-index-000001/_settings
{
  "index.indexing.slowlog.threshold.index.warn": "10s",
  "index.indexing.slowlog.threshold.index.info": "5s",
  "index.indexing.slowlog.threshold.index.debug": "2s",
  "index.indexing.slowlog.threshold.index.trace": "500ms",
  "index.indexing.slowlog.level": "info",
  "index.indexing.slowlog.source": "1000"
}
In the case of indexing, as well as setting the thresholds to be logged, you can also define how much of the source document is sent to the log (by default 1000 characters).
Where do I find the slow logs?
Slow logs are sent to the same folder as your normal logs (by default /var/log/elasticsearch/ if you haven’t specified otherwise in elasticsearch.yml) but with a different file name. By default, the file name is:
 <cluster_name>_index_search_slowlog.log
<cluster_name>_index_indexing_slowlog.log
If you are running on docker, the slow logs will be sent to the std_out stream. You’ll find them with the other Elasticsearch logs.
How to extract slow logs from Elastic Cloud
In order to extract and export slow logs (and the normal logs) from elastic cloud you would need to:
- Enable logging on the cluster by following this guide.
- Run Logstash with the following configuration. This would basically read the logs from the EC cluster and write them to a file locally.
How to interpret slow logs
[2020-02-10T16:43:29,382][TRACE][index.search.slowlog.query] [2f1yTIZ] [logstash-20200210][4] took[10.4s], took_millis[10466], total_hits[18111], types[], stats[],
search_type[QUERY_THEN_FETCH], total_shards[10], source[{"size":0,"query":{"bool":{"must":[{"range":{"timestamp":{"from":1549266459837,"to":1549871259837,"include_lower":true,
"include_upper":true,"format":"epoch_millis","boost":1.0}}}],"adjust_pure_negative":true,"boost":1.0}},"_source":{"includes":[],"excludes":[]},"stored_fields":"*","docvalue_fields":
[{"field":"timestamp","format":"date_time"},{"field":"utc_time","format":"date_time"}],"script_fields":{"hour_of_day":{"script":{"source":"doc['timestamp'].value.getHourOfDay()",
"lang":"painless"},"ignore_failure":false}},"aggregations":{"maxAgg":{"max":{"field":"bytes"}},"minAgg":{"min":{"field":"bytes"}}}}], id[MY_USER_ID]
The above is an example of a slow log. Its sections include:
| source | the query that was made |
| 2f1yTIZ | the name of the node raising the log |
| [logstash-20200210][4] | index and shard |
| took[10.4s] | the time taken on the shard |
| id[MY_USER_ID] | the client id set by X-Opaque-Id header (see below) |
Bear in mind that the logs are generated from the perspective of the shard, so a single query may generate multiple logs across different nodes and for different shards. The times in the query may not tie up with the times that the application takes to see a result, because the overall query is being processed on multiple shards simultaneously. However, from a resources point of view, we gain valuable information about how long it’s taking for the query to process on any given node/shard.
Consistently slow VS. occasionally slow
Queries may occasionally run slowly because of resource issues. It is possible for a simple, well-constructed query to be slow because of other activities (such as garbage collection or indexing activity) that are taking up resources on the node. In cases like these, the slow query may be a “symptom” of an issue and not the “cause” of it.
For this reason, you should look for queries that are consistently slow. These typically may involve scripts or large cardinality aggregations with large “size”s defined. These are likely to be the causes of slow response and resource usage across the cluster, so they should be prioritized for optimisation.
Tracing the source of queries in your application (X-Opaque-Id Header)
In large applications, it may be difficult to trace which applications are responsible for the slow queries you see in your logs. A solution here is to use an X-Opaque-Id header each time you create a query. The way to do this depends on the client, but for example, in python it can be done like this:
client = Elasticsearch()

# You can apply X-Opaque-Id in any API request via 'opaque_id':
resp = client.get(index="test", id="1", opaque_id="request-1")
This will add an ID to any slow logs generated by this request:
id[request-1]
Notes
In ES8, index.indexing.slowlog.level and index.search.slowlog.level are going to be removed. These settings can be worked around by using appropriate thresholds.
Further References
How to optimize search queries:
https://opster.com/blogs/improve-elasticsearch-search-performance/
How to optimize indexing:
https://opster.com/guides/elasticsearch/operations/elasticsearch-slow-indexing/