
OpenSearch Dashboards
Dashboards are the most useful tool to visualize data stored in Elasticsearch/Opensearch without having to code an entire framework that consumes data from the engine. Dashboards render a nice visualization or interactive chart.
Unsurprisingly, OpenSearch Dashboards will look a lot like Elasticsearch OSS 7.10. When Elasticsearch added many new features, like Lens, OpenSearch was busy taking care of their initial phases.
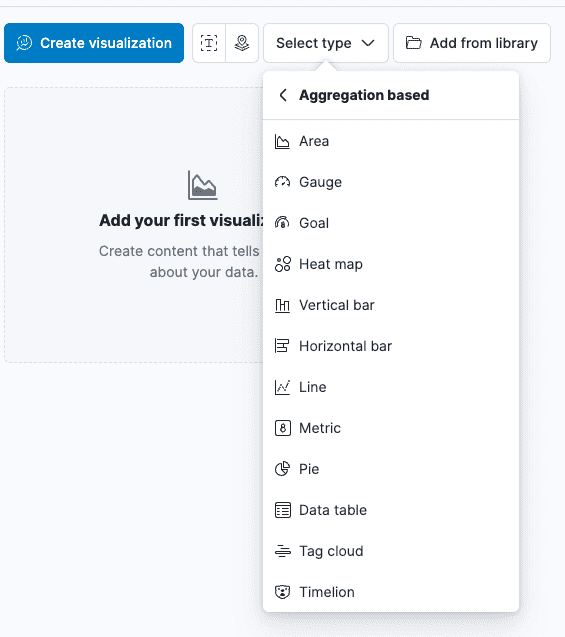
One big difference we can note is that Elasticsearch grouped the aggregation-based visualizations in a separate menu, and released Lens. Lens is a visualization tool that makes aggregation-based visualizations even simpler to create: just drag and drop fields.
In the picture below, clicking on the blue button opens the Lens application.

On the other hand, OpenSearch aims to be more technical and flexible with the creation of Notebooks.
Notebooks are a new type of visualization similar to the Jupyter Python Notebooks. These are interactive computational environments, where you can see the source code that will be run, make changes and see the output in the same code block.
Opensearch Notebooks support Visualizations, Markdown Texts, SQL and PPL (Piped Processing Language) query languages to generate interactive tables which users can modify according to their needs.
The idea is to tell a story, with text and data tables, and make it interactive. After finishing, you can create a report of your Notebook. The paged format of Notebook makes it perfect for PDF reports, because the Notebook width is the same as one regular PDF page.
Where Elasticsearch focuses on simplicity and stunning visualizations, it seems Opensearch is betting to give the users more power and flexibility with more and more varied types of visual assets to work with.
Elasticsearch 8.1 released new types of charts, and Opensearch plans to give the clients the ability to brand their Visualizations, create Notebooks, or Observability Apps.
We can’t know for sure how things will look down the line, but we can check the available information about the Roadmaps of each of the libraries.
Kibana Projects
Projects · elastic/kibana · GitHub
Opensearch Roadmap
How to create Notebooks
We will be creating a Notebook and diving into the functionalities and potential that it offers us.
The big difference between a Dashboard and a Notebook is that you can guide your users with the Notebook, and allow them to manipulate the actual queries.
Notebooks are part of the observability suite, so go to Observability and then Notebooks:
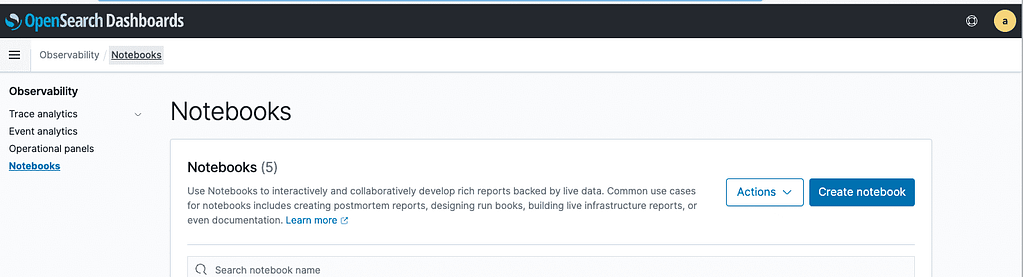
Click “Create Notebook”.
You can click the blue arrow within each block to edit its contents:

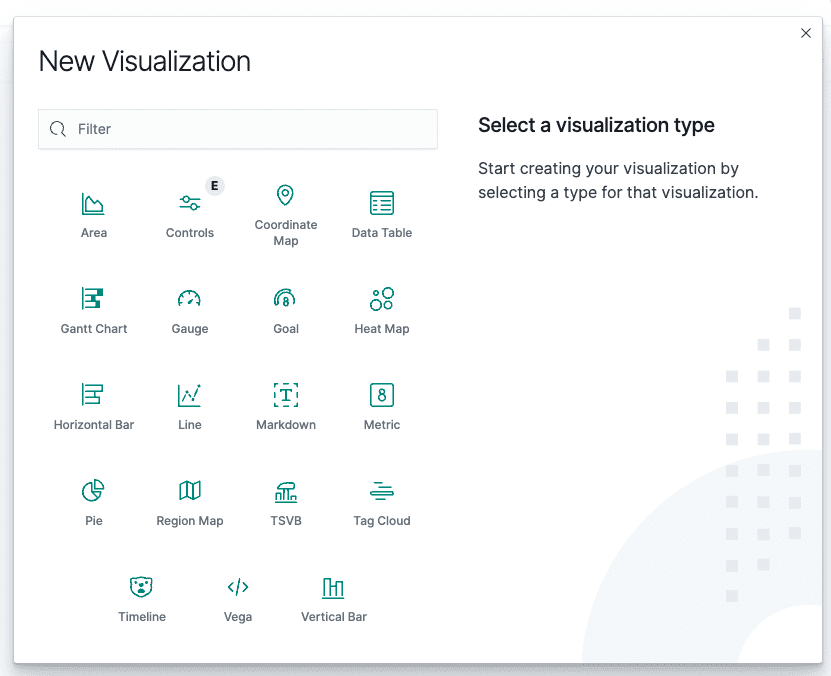
When creating a block you can choose between Visualization or Code Block.

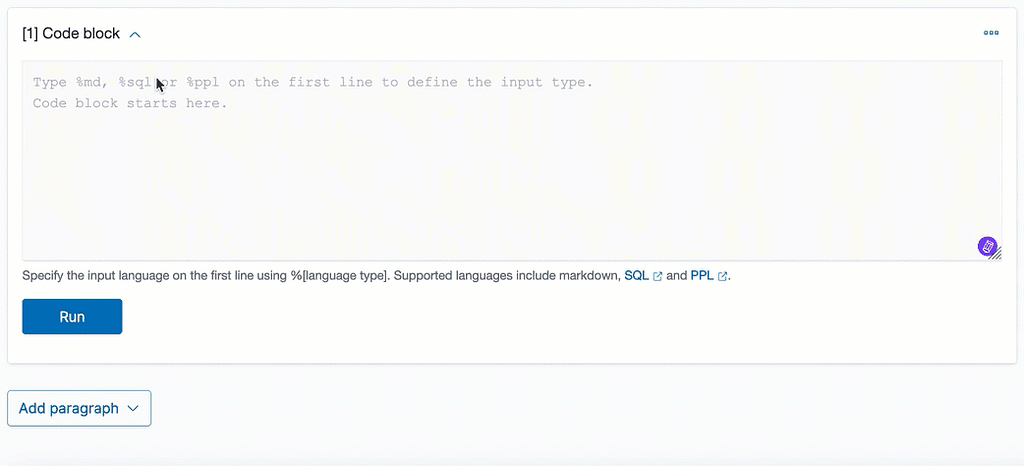
To start a code block you have to define the type of content you want to put in the first line. Options are %md (text) , %sql and %ppl for queries.
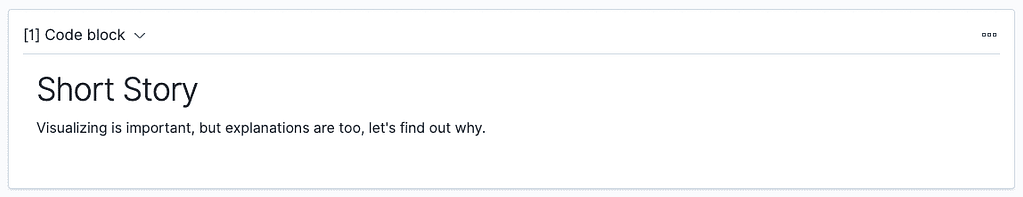
Let’s build our first block with the following content:
%md
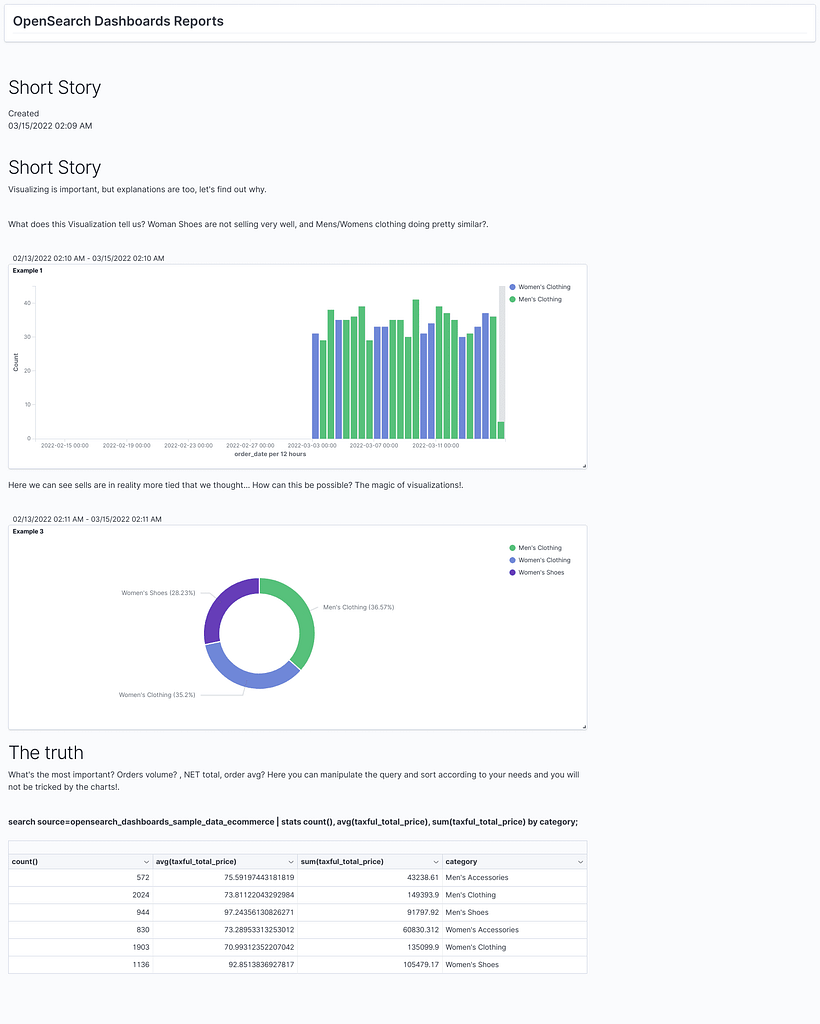
# Short Story
Visualizing is important, but explanations are too, let’s find out why.
* # applies a title style to the text
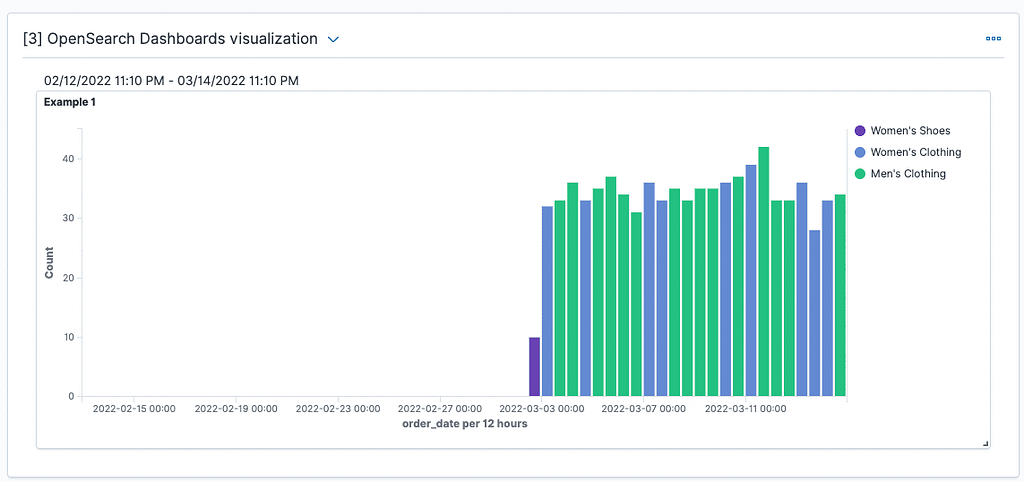
To add a visualization simply select “Visualization” from the insert paragraph menu and search for it in the library.
Finally, for the query syntax block you can use either SQL or PPL syntax.
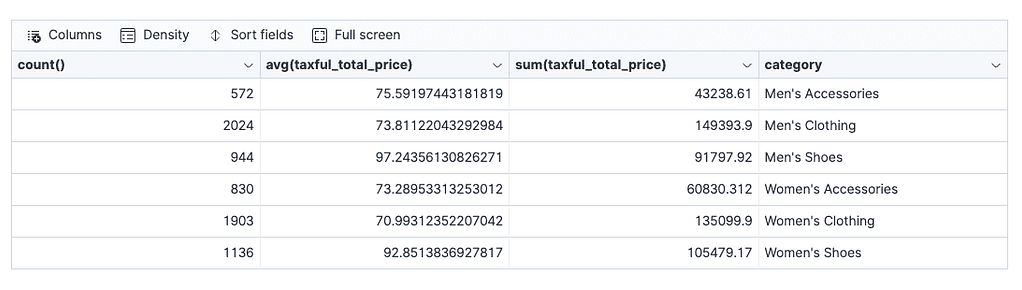
We will generate a PPL query to display the count of documents, average of order total price, and sum of orders total price in a single table:
%ppl
search source=opensearch_dashboards_sample_data_ecommerce
| stats count(), avg(taxful_total_price), sum(taxful_total_price) by category;
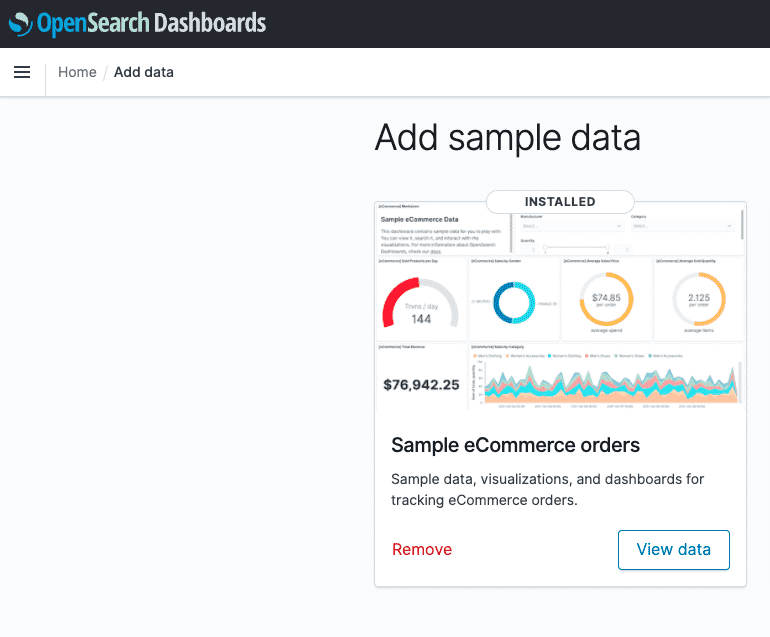
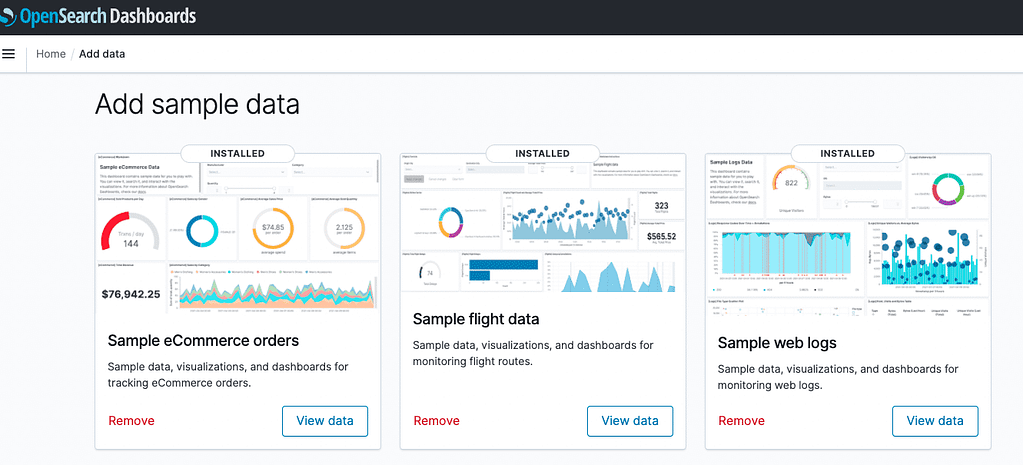
We are using the Kibana e-commerce example data that can be loaded from Dashboards Home > Add Sample Data Menu.
Finally, we can generate a PDF or PNG report of our notebook in the reporting menu.

This is how our brand new Notebook looks:
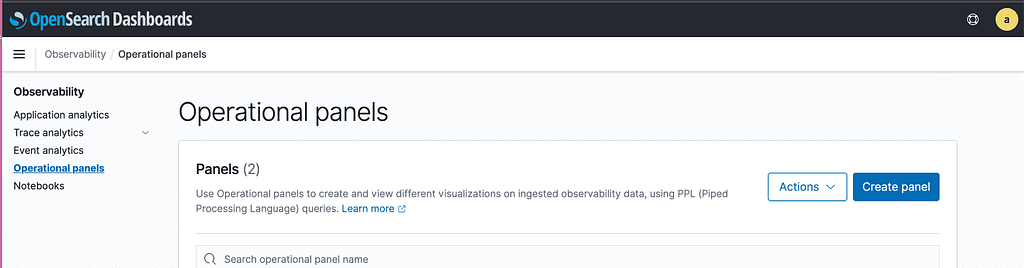
How to use Operational Panels
Operational panels are just like Dashboards, but allow users to build the query to create the visualization using PPL (Piped Processed Language). This way, you have more flexibility on how each bar is generated.
Operation panels are meant to be used with machine generated data like logs, so the visualization folds.
To use your visualizations in an Operation Panel you have to create it in the Event Analytics section of observability:
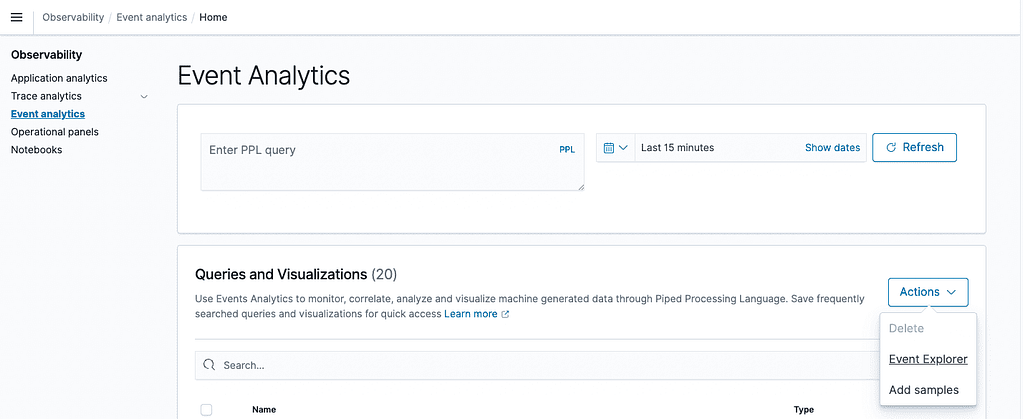
How to use Event Explorer
The event explorer is a mix of the classic “Discover” section, and “Visualizations”. You have 2 tabs: “Events”, and “Visualizations”. You can save searches or visualizations based on PPL queries.
Let’s try it. For this we will need the sample web logs dataset:
We will try with the following PPL query:
source = opensearch_dashboards_sample_data_logs | where response = ‘200’
Then press Refresh.
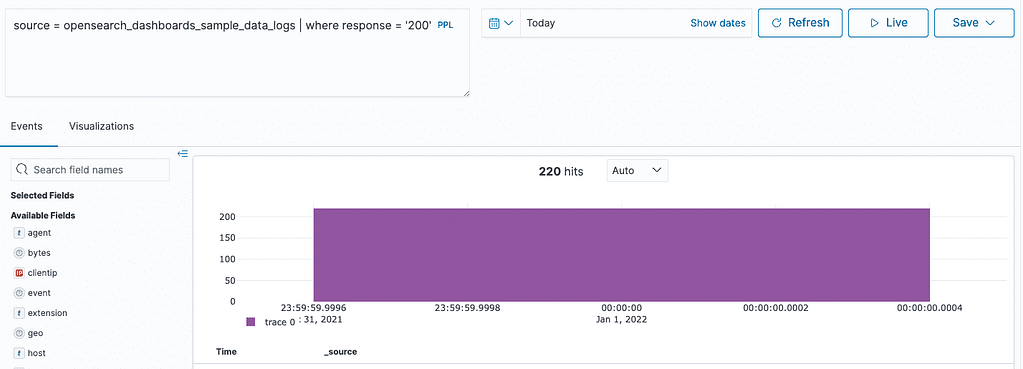
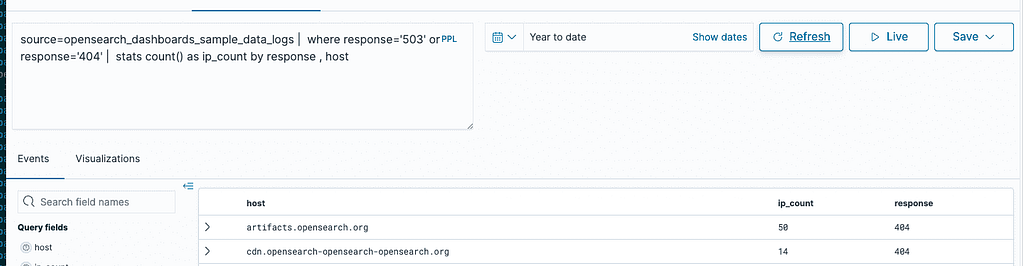
We will see all the logs with the status code 200, and we can use all of the PPL features. Let’s make it a bit more sophisticated:
source=opensearch_dashboards_sample_data_logs | where response=’503′ or response=’404′ | stats count() as ip_count by response , host
With this query we group our logs by different fields, in this case by host > ipcount > response code.
If the query includes aggregations (grouping), like this one, we can also generate visualizations by switching to the Visualizations tab.
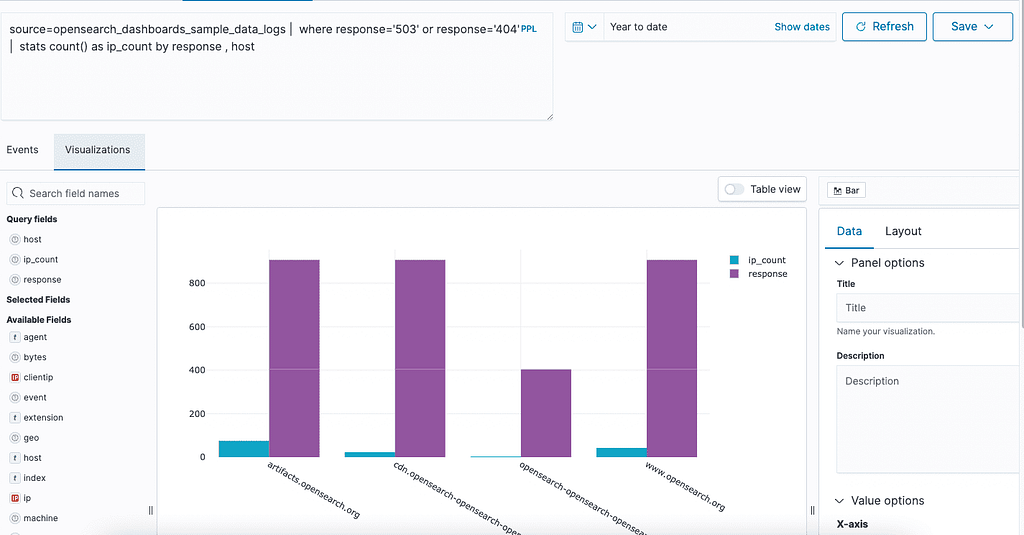
Then we can go ahead, save it and add it to our Operational Panel.
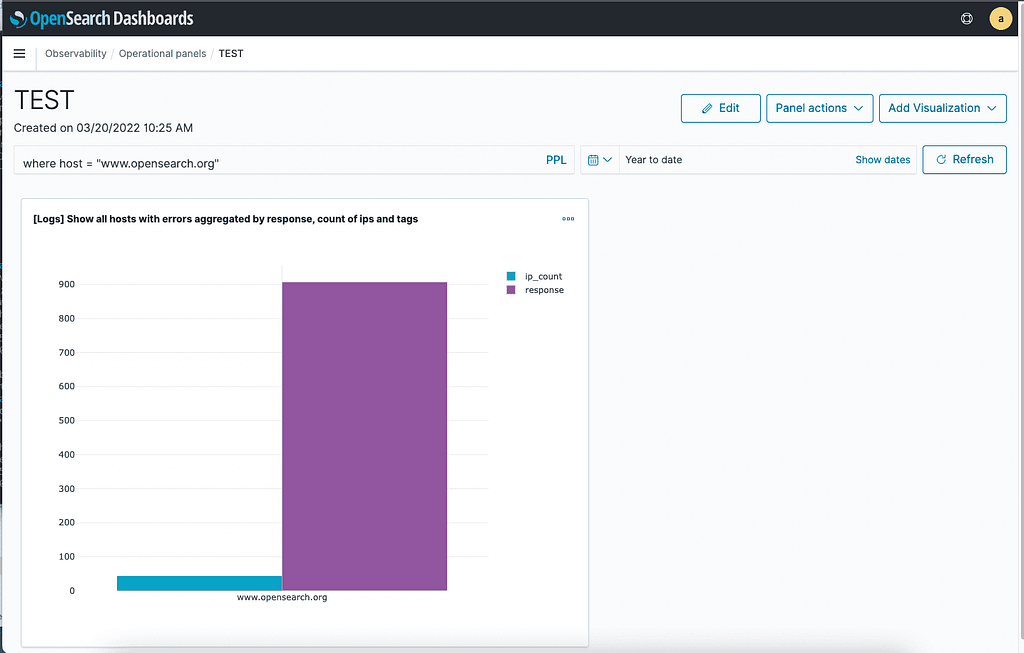
As you can see, filters can be added using PPL too.
Conclusion
In terms of Dashboards, Opensearch remains the same as its initial version (like Elasticsearch 7.10) because the main focus has been on Observability. OpenSearch created two new tools that help visualize logs to generate reports or quickly explore and detect failures. These tools are:
- Notebooks
- Operational panels
There are additional tools related to Trace analytics that we will explore in future articles.
Additional notes
Elasticsearch and OpenSearch are both powerful search and analytics engines, but Elasticsearch has several key advantages. Elasticsearch boasts a more mature and feature-rich development history, translating to a better user experience, more features, and continuous optimizations. Our testing has consistently shown that Elasticsearch delivers faster performance while using fewer compute resources than OpenSearch. Additionally, Elasticsearch’s comprehensive documentation and active community forums provide invaluable resources for troubleshooting and further optimization. Elastic, the company behind Elasticsearch, offers dedicated support, ensuring enterprise-grade reliability and performance. These factors collectively make Elasticsearch a more versatile, efficient, and dependable choice for organizations requiring sophisticated search and analytics capabilities.