
Are you making the same mistakes as everyone else?
Elasticsearch users know just how easy it is to misstep when setting up and configuring your system, and what happens when you fail to notice issues before they start to negatively impact your performance.
We have the largest database on Elasticsearch deployments, both self-hosted & managed. Over 3,000 Elasticsearch users have run Opster’s free Check-Up tool, and we took a look at the patterns emerging from all their results. From our analysis of their clusters, it’s clear to see that many people are making the same mistakes – mistakes that you can avoid if you know what to look out for.
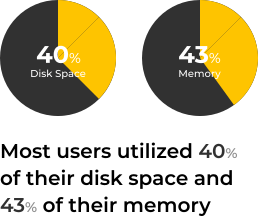
So what can be learnt from all of this? Most of the clusters analyzed by the Check-Up were Elasticsearch version 7. 26% of those who ran the Check-Up are from the United States and 18% are from Europe. Most users utilized 40% of their disk space and 43% of their memory. 18% were using more than 70% of their disk.

Clusters of over 10 nodes had more issues than smaller clusters. This aligns with the fact that smaller clusters are easier to manage. However, one would usually think that the larger the cluster, the more vital it is to the company, and therefore more resources would be dedicated to maintaining it and prevent issues from occurring.
More importantly, Elastic’s documentation is great for small scale operations, but the more you scale, the more you have to know and understand more about operations. You need to know when to follow the best practices, and when to customize your own solution based on your needs.
We broke down the most common configuration missteps and system oversights into the categories you see below.
Are you ready to see how you compare to 3,000 other Elasticsearch users?
Best practices
Best practices cover small, recommended changes that could make a big difference in your system’s performance. Tracking and implementing best practices is not always easy because the information is often spread around the internet in different forums and with variations based on Elasticsearch versions.
One important best practice is changing your cluster name from the default (‘elasticsearch’) which could prevent future issues in discovery, and even prevent accidental deletion of data. 20% of Elasticsearch users who ran the Check-Up didn’t assign their clusters a name and stayed with the default one, leaving them with an unnecessarily riskier operation.
Another important best practice, that only 8.2% of users implemented, is restricting the use of wildcards for destructive (delete) operations. Using wildcards could cause accidental deletion of all of your data – and yet 91.8% of people did not avoid that risk by easily disabling deletion of indices via wildcards.


Scripts
Elasticsearch scripts can be very powerful and useful for analyzing your data, however they might place a heavy load on your cluster, particularly if the scripts are not written carefully with thought for the resources they may utilize. For this reason, it’s recommended to limit both the type of scripts that can run on a cluster, and also the contexts in which scripts can run.
Limiting script access is also good practice when it comes to security considerations, in addition to performance ones.
An astounding 88% of users did not limit script contexts and script types. If scripts are not restricted, they can accidentally break the cluster by overloading it. Though some applications may require scripts to enable them to run correctly, many users simply don’t think of implementing these limits that could ensure resources are funneled into the right places.
7.7% of users had regex enabled in their painless scripts. Regex, short for regular expression, refers to a technique for searching using a sequence of characters defining a search pattern. Regex must be used with care in painless scripts, since some expressions can be extremely slow and require a great deal of resources to run. This is why regex is disabled by default. If you choose to enable regex, make sure to implement it properly, test performance and monitor your resources closely.


Cluster architecture
Elasticsearch deployments serve many different use cases, each of which requires different architecture.
For clusters that are large enough, we highly recommend having dedicated master nodes and dedicated coordinating nodes – they’re crucial for better performance.
Many of those who ran the Check-Up did not have these set up. 16% did not have enough dedicated coordinating nodes, and 12.8% did not have enough dedicated master nodes.
Out of the users with clusters below version 7.x, 30% had incorrectly configured the value in their minimum_master_ nodes setting, running the risk of split-brain. When the value is set to less than what is needed for a quorum, nodes that disconnect for any reason could form a separate cluster that is independent from the primary cluster. Fortunately, this issue was resolved starting v7.


Cluster performance
There are many various elements that affect cluster performance. That’s one of the reasons it is so important to stay on top of all your real-time stats by closely monitoring your cluster. The Check-Up covers many aspects of cluster performance, checking a snapshot of CPU levels, circuit breakers, heap size, various queues and more.
15% of Elasticsearch users had high circuit breaker tripped counts, leading to search or indexing requests being aborted and causing applications to throw exceptions. Circuit breakers are used to protect the node from situations that could cause it to crash due to lack of resources, particularly when memory usage gets close to operating limits.
The CPU utilization on nodes was high for over 11% of users, which causes high search and indexing latencies, rejected requests and possible time-outs. Following that, we found that 7.7% of users had high search rejected queues, and when searches are being rejected, client applications will of course not function as expected.
When we looked into index queues, we found that 5.1% of Elasticsearch users had high queues, indicating that there weren’t enough resources for processing all indexing operations. This could lead to rejected indexing operations and slower search operations, affecting customers across the board.
Most users, 95.9%, were careful with their heap size configuration. It is recommended to use at most 50% of the total available RAM, but in no case should the heap size exceed the limit of 32GB. Preferably, it should be less than 26GB. That is the point at which object pointers are not zero based anymore and performance drops. By correctly configuring their heap size limit, these users successfully preserved their Elasticsearch performance.


Disk usage
When it comes to Elasticsearch deployments, you never want to tap out your entire disk. The good news is that Elasticsearch has “watermarks” in place to protect you from reaching that point. The bad news is that most people are not aware of what watermarks are and what happens when they are crossed, as demonstrated by the 13.2% of users who crossed them.
The various “watermark” thresholds on each Elasticsearch cluster are used to monitor disk usage. As the disk space fills up on a node, the first threshold to be crossed will be the “low disk watermark”. 5.3% of the Elasticsearch users who ran the Check-Up had disk usage that exceeded that threshold, meaning that Elasticsearch will not allocate replica shards to those nodes that have exceeded the threshold. This could result in the cluster becoming unbalanced and changing status to Yellow, or even Red.
The second threshold will be the “high disk watermark”. 4.1% of Elasticsearch users had nodes that exceeded this threshold, meaning that Elasticsearch will actively start to relocate shards from the nodes in question to other Elasticsearch nodes in the cluster. This could cause additional load and lead to the cluster becoming unbalanced.
Finally, the “disk flood stage” is the last watermark reached when there is no available disk space anymore. 3.8% of users exceeded this watermark. Once this threshold is passed, the cluster will block writing to all indices that have one shard (whether primary or replica) on the node which has passed the watermark, potentially causing many indexing exceptions. Reads (searches) will still be possible.


Note that there might have been additional clusters exceeding these thresholds at different times, seeing as the percentages above represent only the levels of disk usage at the time the user ran the Check-Up.
Miscellaneous
There are over 50 other checks included in the Elasticsearch Health Check-Up, covering all of the important aspects of ES configuration and performance. Opster’s Community Tools are currently being integrated into Elastic. Stay tuned for an enhanced solution!