
One of Opster’s customers, a cybersecurity company, maintains a large cluster that needs to manage a huge write load at all times. This write load needs to be handled in real-time in order to scan for vulnerabilities and serve the application as required.
In the incident we’re going to discuss, AutoOps detected that the cluster had stopped indexing. AutoOps raised 3 events for this:
- Index queue filled up
- Slow indexing performance
- Rejected indexing
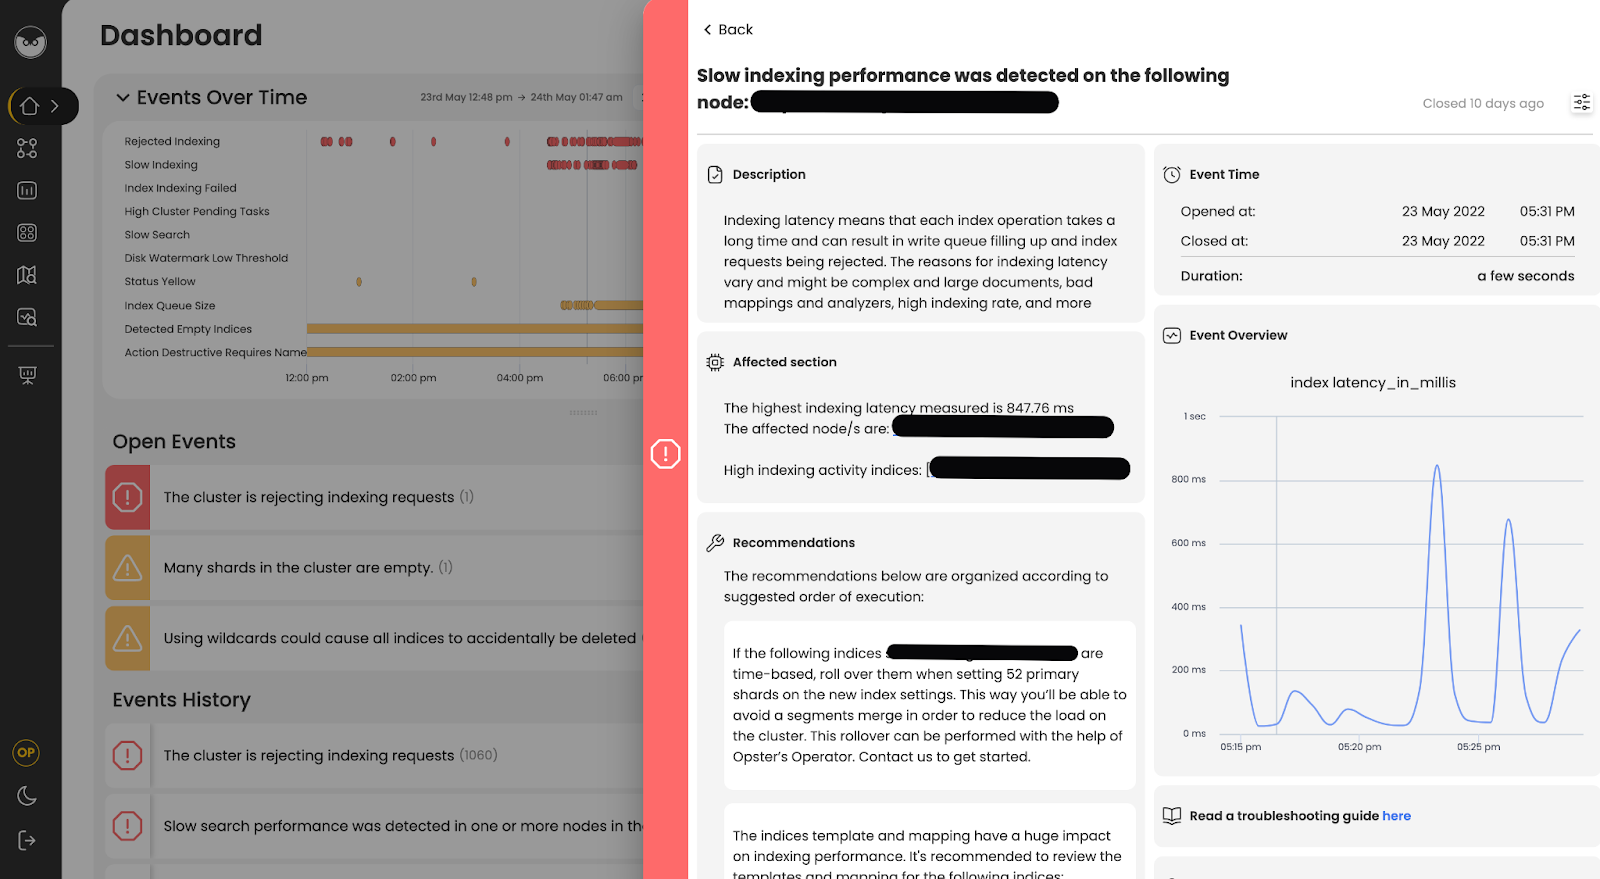
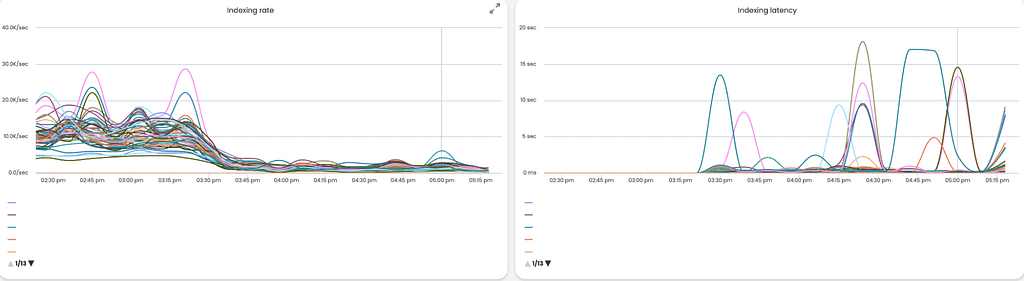
As you can see in the event and graphs above, indexing went down to almost 0, while indexing latency sky-rocketed to more than a few seconds on average.
Seeing as this customer needs indexing to be carried out in realt-ime, this situation caused multiple significant issues for them:
- No fresh data was visible in their system, meaning real-time scanning was delayed.
- As the indexing throughput is high, it caused a huge backlog of data that needed to be indexed just piling up, waiting for the cluster to be available again. Lag was building up quickly.
Troubleshooting
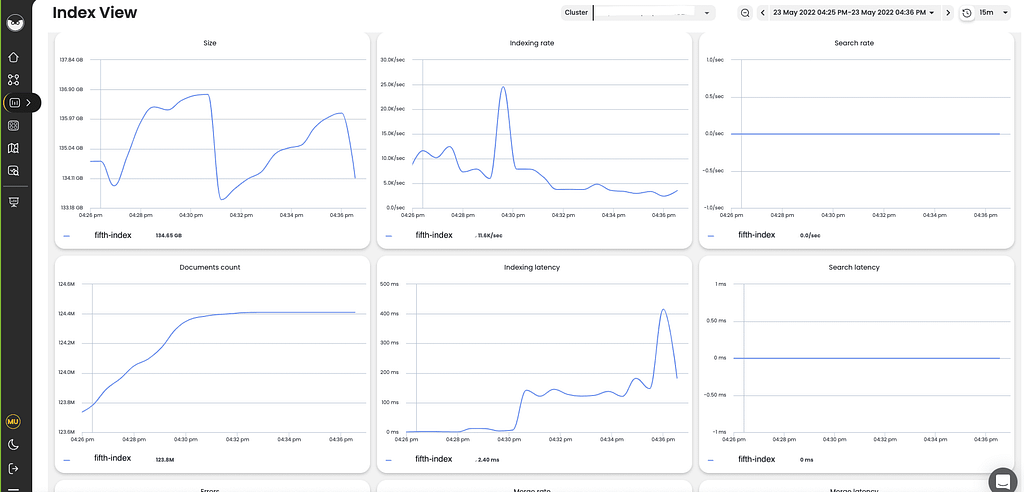
Opster’s support team began troubleshooting, looking for the root cause using AutoOps. It was clear that there was a specific index with very high indexing latency.
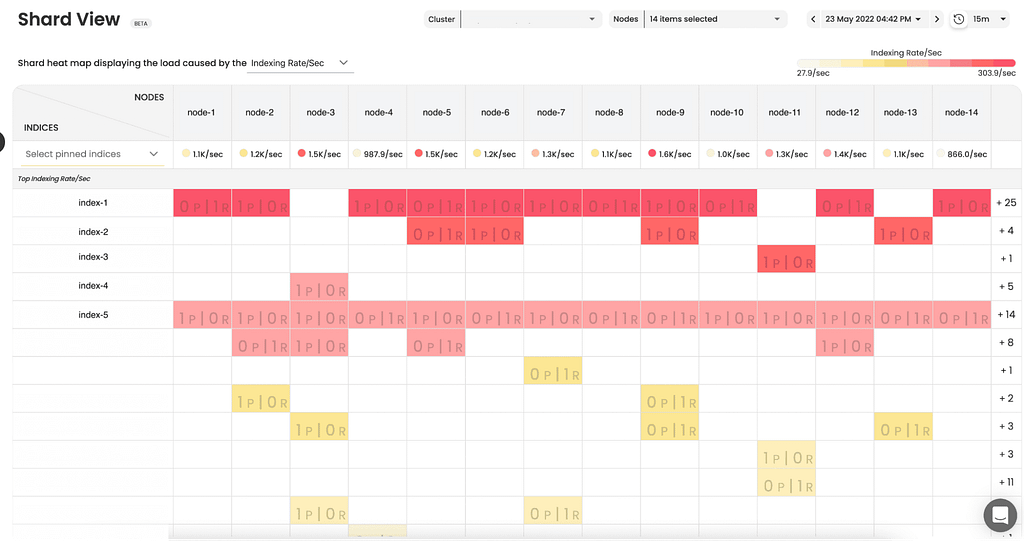
When looking at Shard View for that index, it was clear that the index in question wasn’t carrying out the highest indexing rate and wasn’t spread across all nodes. This means it wasn’t a matter of indexing bursts or highest activity indices, which would usually be the most suspicious type of index.
The system recommended an analysis of the slow indexing logs for that specific index, which we collected and analyzed. Analyzing the slow log file with Opster’s tools, it was very clear that there are specific documents that are taking seconds to be indexed (for reference, a single document should take around a few milliseconds to be indexed, at most).
We then located the document type. When examining the documents, one field stood out as suspicious because it contained a very long field with many slashes.
[2022-05-23T15:56:46,092][INFO ][index.indexing.slowlog.index] [data_node_8] [fifth_index] took[7.7s], took_millis[7783], type[_doc], id[BOoWwM3WVfzNZXpG], routing[], source[{"url":"\\folder\\testing\\a.b.c.d\\a.b.c.d\\a.b.c.d\\a.b.c.d\\a.b.c.d\\a.b.c.d\\a.b.c.d\\a.b.c.d\\a.b.c.d\\a.b.c.d\\a.b.c.d\\a.b.c.d\\a.b.c.d\\a.b.c.d\\a.b.c.d\\a.b.c.d\\a.b.c.d\\a.b.c.d\\a.b.c.d\\a.b.c.d\\a.b.c.d\\a.b.c.d\\a.b.c.d\\a.b.c.d\\a.b.c.d\\a.b.c.d\\a.b.c.d\\a.b.c.d\\a.b.c.d\\a.b.c.d\\a.b.c.d\\a.b.c.d\\a.b.c.d\\a.b.c.d\\a.b.c.d\\a.b.c.d\\a.b.c.d\\a.b.c.d\\a.b.c.d\\a.b.c.d\\a.b.c.d\\a.b.c.d\\a.b.c.d\\a.b.c.d\\a.b.c.d\\a.b.c.d\\a.b.c.d\\a.b.c.d\\a.b.c.d\\a.b.c.d\\a.b.c.d\\a.b.c.d\\a.b.c.d\\a.b.c.d\\a.b.c.d\\a.b.c.d\\a.b.c.d\\a.b.c.d\\a.b.c.d\\a.b.c.d\\a.b.c.d\\a.b.c.d\\a.b.c.d\\a.b.c.d\\a.b.c.d\\a.b.c.d\\a.b.c.d\\a.b.c.d\\a.b.c.d\\a.b.c.d\\a.b.c.d\\a.b.c.d\\a.b.c.d\\a.b.c.d\\a.b.c.d\\a.b.c.d\\a.b.c.d\\a.b.c.d\\a.b.c.d\\a.b.c.d\\a.b.c.d\\a.b.c.d\\a.b.c.d\\a.b.c.d\\a.b.c.d\\a.b.c.d\\a.b.c.d\\a.b.c.d\\a.b.c.d\\a.b.c.d\\a.b.c.d\\a.b.c.d\\a.b.c.d\\a.b.c.d\\a.b.c.d\\a.b.c.d\\a.b.c.d\\a.b.c.d\\a.b.c.d\\a.b.c.d\\a.b.c.d\\a.b.c.d\\a.b.c.d\\a.b.c.d\\a.b.c.d\\a.b.c.d\\a.b.c.d\\a.b.c.d\\a.b.c.d\\a.b.c.d\\a.b.c.d\\a.b.c.d\\a.b.c.d\\a.b.c.d]The combination of the analysis configured in the template and the long values with many slashes cause each document to take ages to be analyzed and indexed.
After detecting the document and suspicious field, we disabled the field itself in the template by setting its property to “enabled:false”, which essentially disabled the field analysis and rolled over the index to a new index with the new mapping. Once this was completed, indexing latency dropped and indexing throughout returned to normal. The incident was resolved.
Key takeaway
The key takeaway from this is to try to avoid using expensive analyzers as much as possible. Regex can be tricky because different inputs can act and behave differently in an unexpected manner. It is a good practice to enable indexing slow logs so that when indexing begins slowing down, you already have pointers and clues as to the root cause.
Resolve and Prevent with AutoOps
AutoOps is used by companies all around the world to troubleshoot, resolve and prevent cases just like this one. If you’d like to get started, improve performance and also reduce your hardware costs, contact us here.