
Quick links
- Introduction to alerts in OpenSearch
- How to create a Channel to receive alerts
- System alerts
- Log alerts
- Business alerts
- Conclusion
Introduction to alerts in OpenSearch
After setting up access control and audit logs in OpenSearch, we can set up a very complete alerting system.
For our purpose, there are 3 types of alerts in OpenSearch:
- System – alerts related to cluster health, memory, CPU, disk usage, etc.
- Logs – alerts related to access logs or error logs.
- Business specific – alerts related to personal business requirements.
OpenSearch allows you to identify many different scenarios and send needed notifications via email, Slack, or Amazon Chime.
It’s important to understand some key terms in order to fully understand alerts. These concepts are represented by the following diagram:
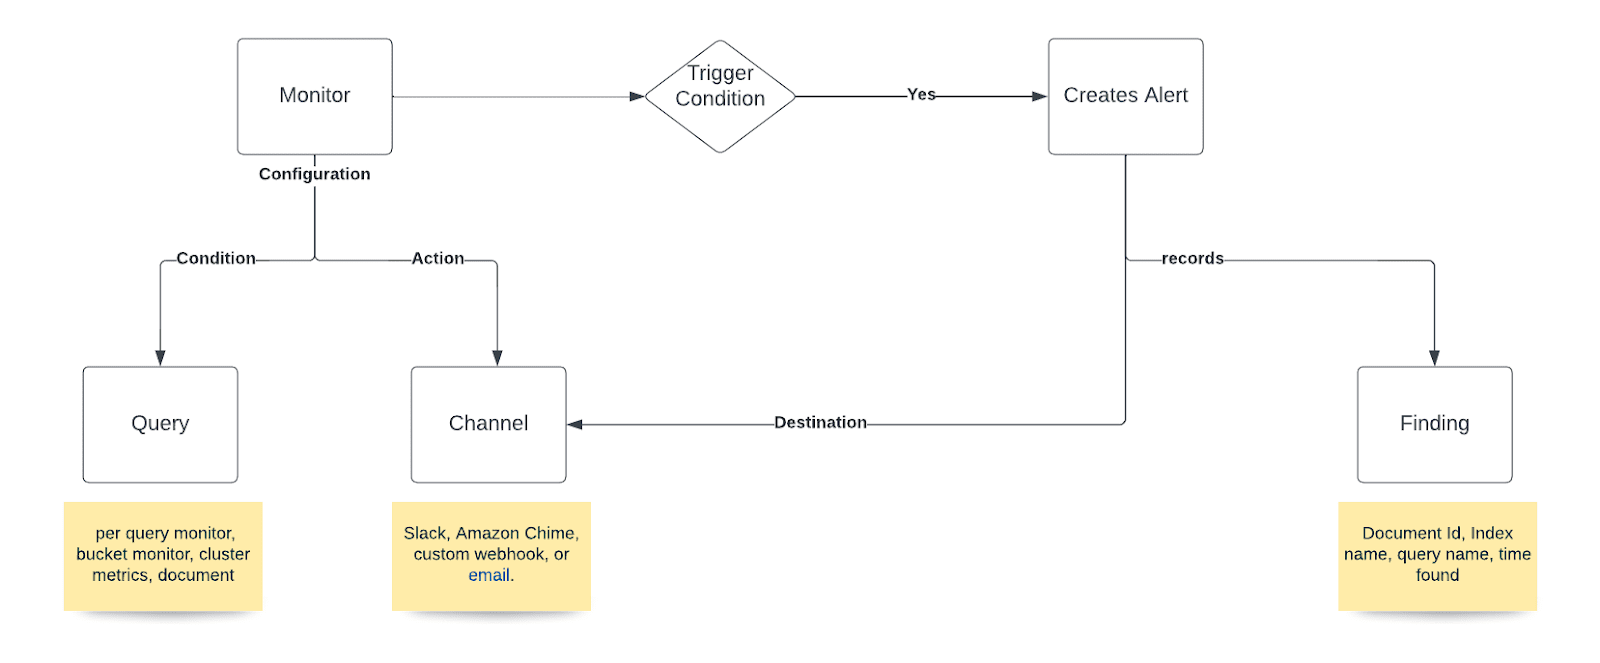
A monitor needs to be created with a query condition, and one or many actions mapping to different channels. When a query condition matches, an alert is created and the finding is recorded.
How to create a Channel to receive alerts
Before creating any alerts, we need to create a Channel, which is the destination to which we’d like to send our alert.
Notification Channels
OpenSearch supports the following Channel options:
- Amazon Chime
- Amazon Simple Notification Service (Amazon SNS)
- Amazon Simple Email Service (Amazon SES)
- Email through SMTP
- Slack
- Custom webhooks
Creating an Email (SMTP) Channel
To demonstrate the process for creating Channels, we will configure an Email (SMTP) Channel.
Go to “Channels” under the Notifications section, and click “Create Channel”.

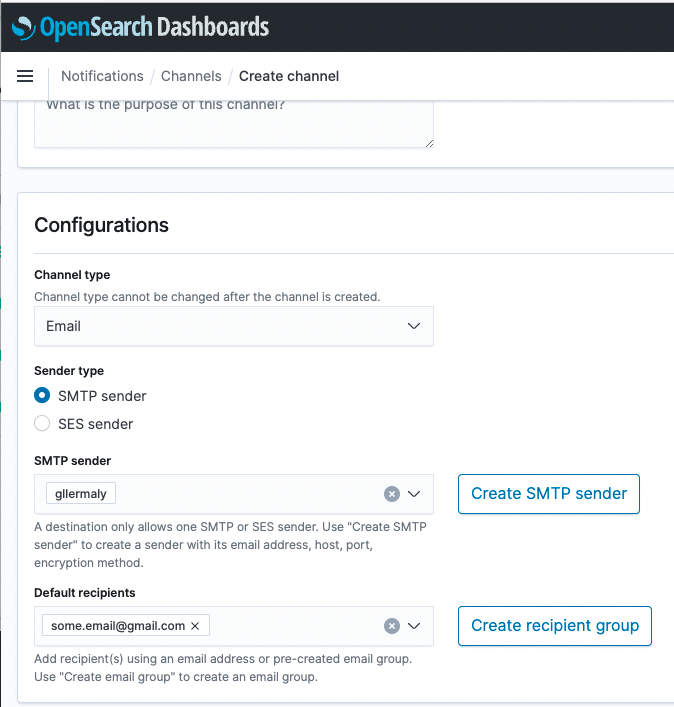
For the Email channel we need to create an SMTP sender and attach it to the Channel. We can also add different user groups to make distribution easier.
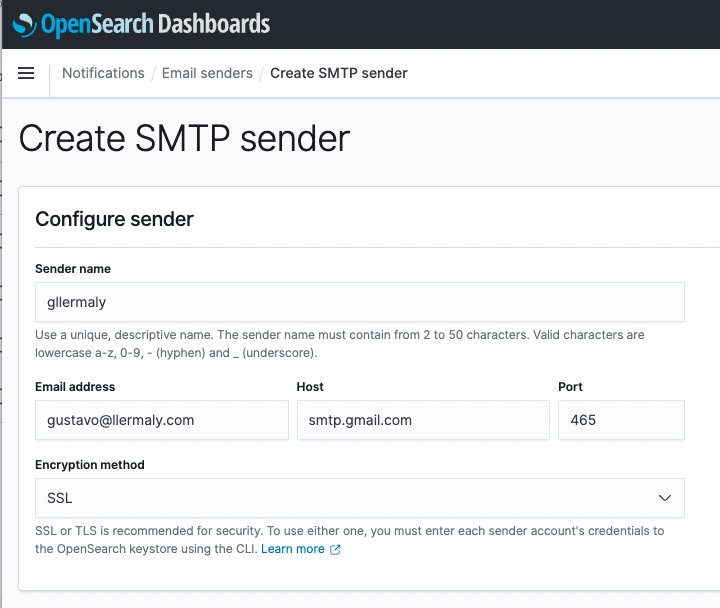
Creating an SMTP sender
For this example, we will use Gmail as the Email SMTP server provider. You cannot use your current password for external access, you have to create an App Password, and use it as password to login using your Gmail address.
Create the SMTP sender with the following details:
To use SSL encryption, you need to add the credentials to the keystore using the CLI on each node and then restart:
./bin/opensearch-keystore add plugins.alerting.destination.email.<sender_name>.username
./bin/opensearch-keystore add plugins.alerting.destination.email.<sender_name>.password
For this example <sender_name> would be “gllermaly”. After you insert each of those commands, the username (email address) and password (App Password) will be prompted.
Now you can go ahead and create a new Channel using the SMTP sender you just created:
After creating the email Channel, we can go back to “Monitor” and create one.
1. System alerts
To demonstrate how to set up system alerts, we will create a monitor for Cluster Health (system monitor). We will configure an alert to be triggered if the cluster status goes to Yellow or Red.
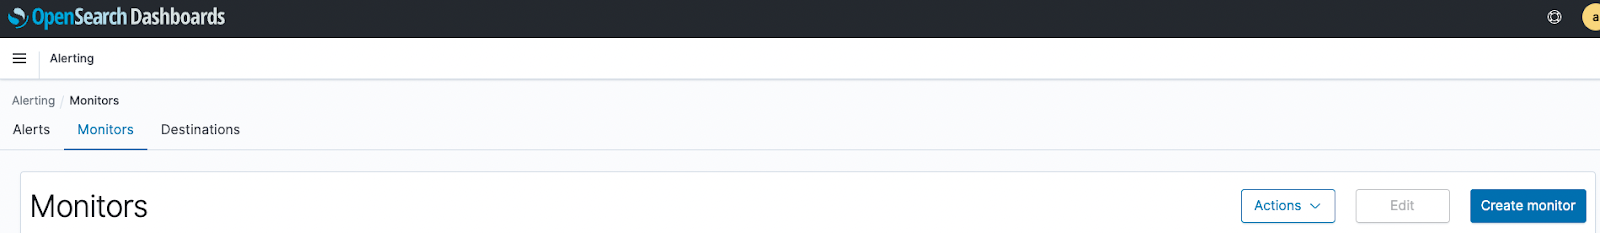
Go to the “Alerting” section under plugins, then click “Create monitor”.
Then select “Per cluster metrics monitor”. This monitor type is made to alert based on common REST API responses. Then set the frequency according to your needs.

In the “Query” section select “Cluster health” as the request type, and click “Preview Query” to see the available parameters.
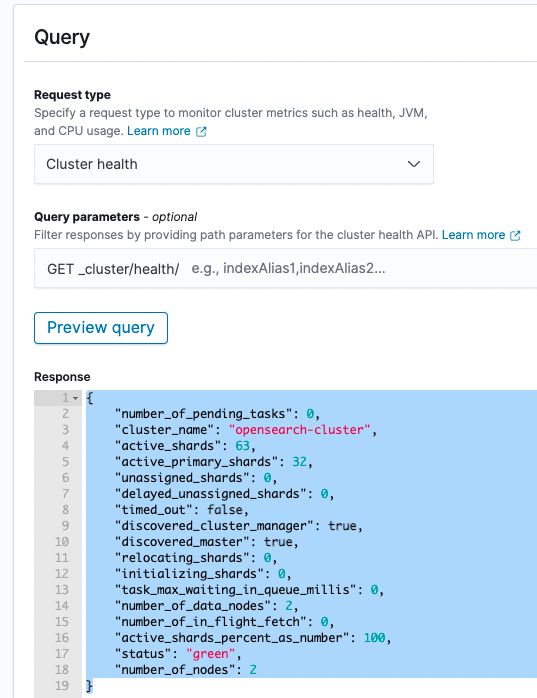
We will use the “status” property, and notify if it changes to red or yellow, assigning different priorities to each action.
Click “Add trigger” under the triggers section.
For the red status we will set the severity to high, and an email notification. OpenSearch provides a default body you can customize.
The trigger condition will be : ctx.results[0].status == “red”;
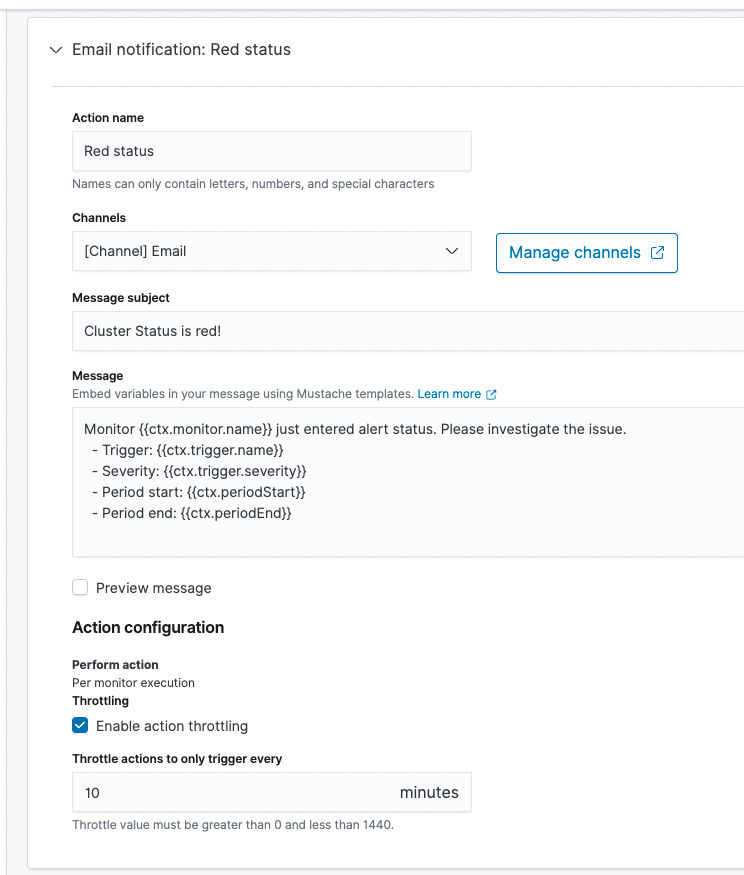
You can enable “action throttling” to avoid spamming with alerts.
To create the alert for yellow status, we can create a new trigger and just replace “red” with “yellow” in the condition and assign a lower severity to this alert.
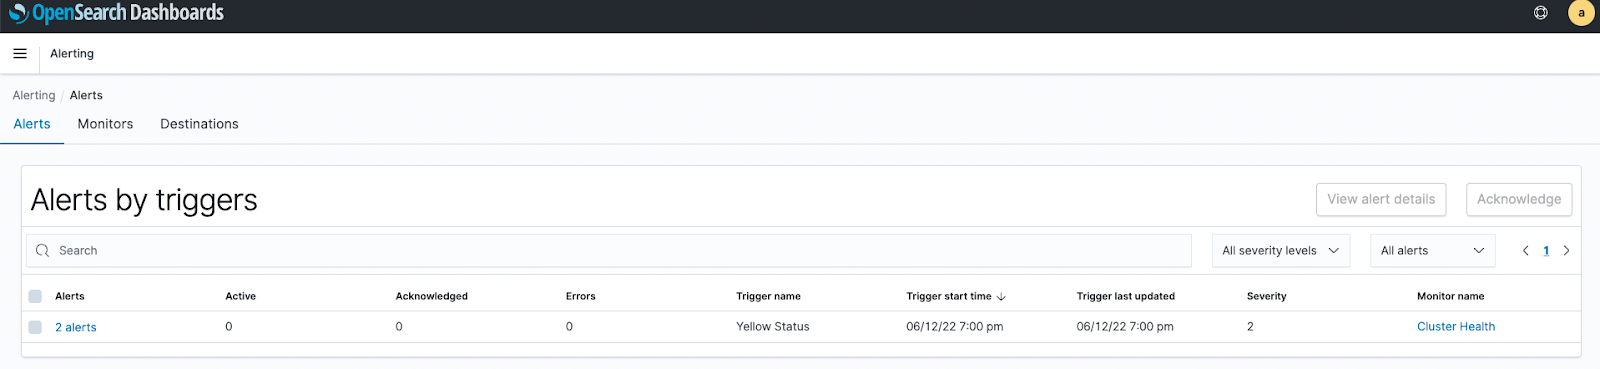
Now everytime the cluster changes to red or yellow, an alert will be created, and you can monitor it from the “Alerts” panel:
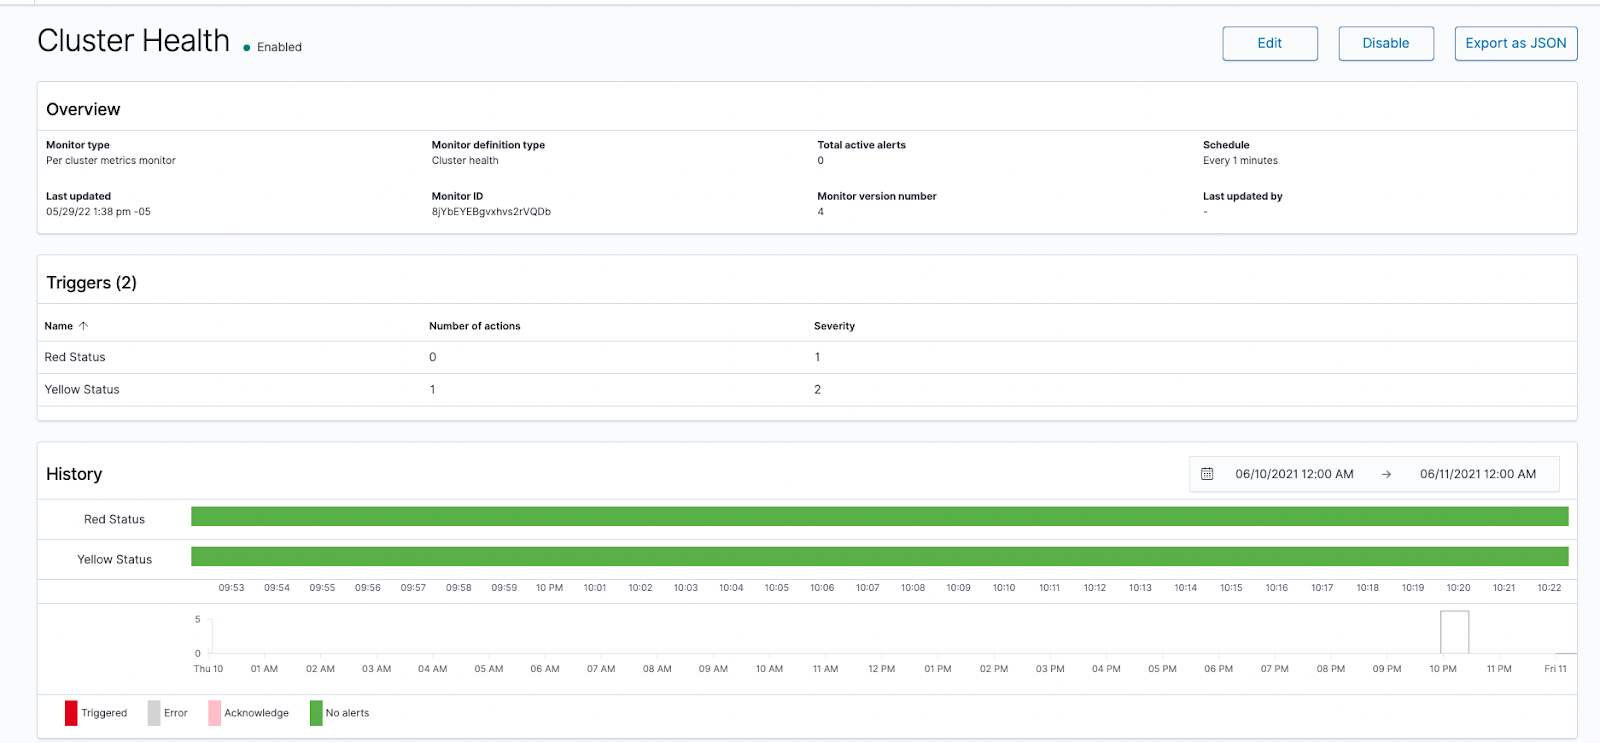
You can get more insights about all the triggers of the monitor by going to the “Monitors” tag:
2. Log alerts
For this example, we’re going to configure an alert to let us know if a user has an unusual number of failed authentication attempts. We need to track the audit_category = FAILED_LOGIN, in the security-auditlog-* index pattern.
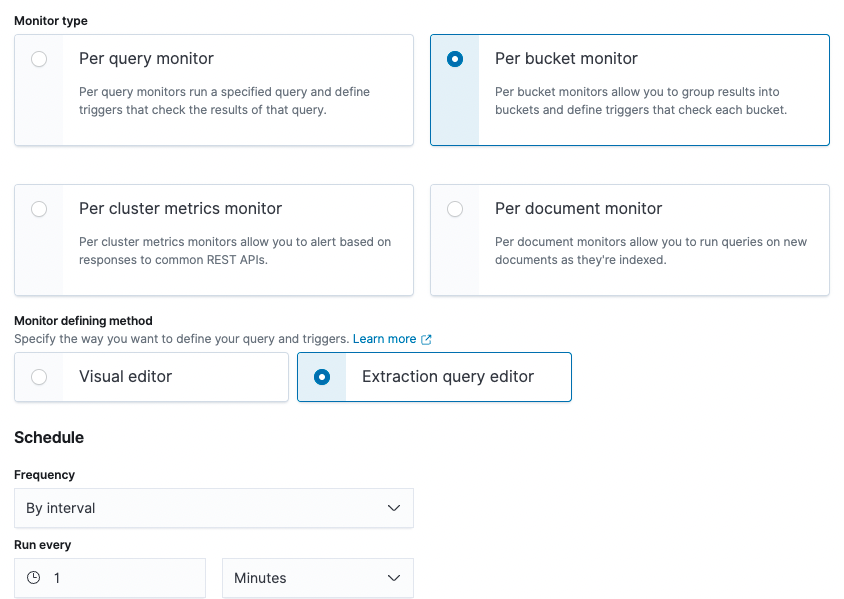
For this alert we will use the “Per bucket monitor” type, to aggregate by user, and then trigger an alert if a user exceeds a certain number of attempts in a set period of time. For this example, let’s say 20 attempts in the last hour.
We will use the extraction query editor for this purpose.
The code for the Query section is the following:
{
    "size": 0,
    "query": {
        "bool": {
            "filter": [
                {
                    "term": {
                        "audit_category.keyword": {
                            "value": "FAILED_LOGIN"
                        }
                    }
                },
                {
                    "range": {
                        "@timestamp": {
                            "from": "now-1h"
                        }
                    }
                }
            ]
        }
    },
    "aggregations": {
        "users": {
            "terms": {
                "field": "audit_request_effective_user.keyword"
            }
        }
    }
}
The trigger conditions section must contain the following code:
{
    "buckets_path": {
        "doc_count": "_count"
    },
    "parent_bucket_path": "users",
    "script": {
        "source": "params.doc_count > 20",
        "lang": "painless"
    },
    "gap_policy": "skip"
}
This way it will evaluate the “users” bucket from the query, and trigger the alert if any user exceeds 20 documents previously filtered by event FAILED_LOGIN. Something to consider is that if many users meet these conditions, one alert will be generated per user, which can add up.
The email alert will look like this:
Monitor server_flood just entered alert status. Please investigate the issue.
- Trigger: login failed
- Severity: 1
- Period start: 2022-06-20T17:23:53.028Z
- Period end: 2022-06-20T17:24:53.028Z
- Deduped Alerts:
- GxMhgoEBq_Jl1BdSqdWD : hacker
Hacker is the username that had more than 20 failed login attempts in the last hour.
3. Business alerts
Seeing as business alerts are unique per specific business requirements, let’s refer to the example of Happylily, Inc.
For this alert we want to know if a user with an “Angry” mood is created, so the manager can give them special attention.
For this purpose we will use the “Per document monitor” that will check every document indexed for a value.
The configuration should look like this:


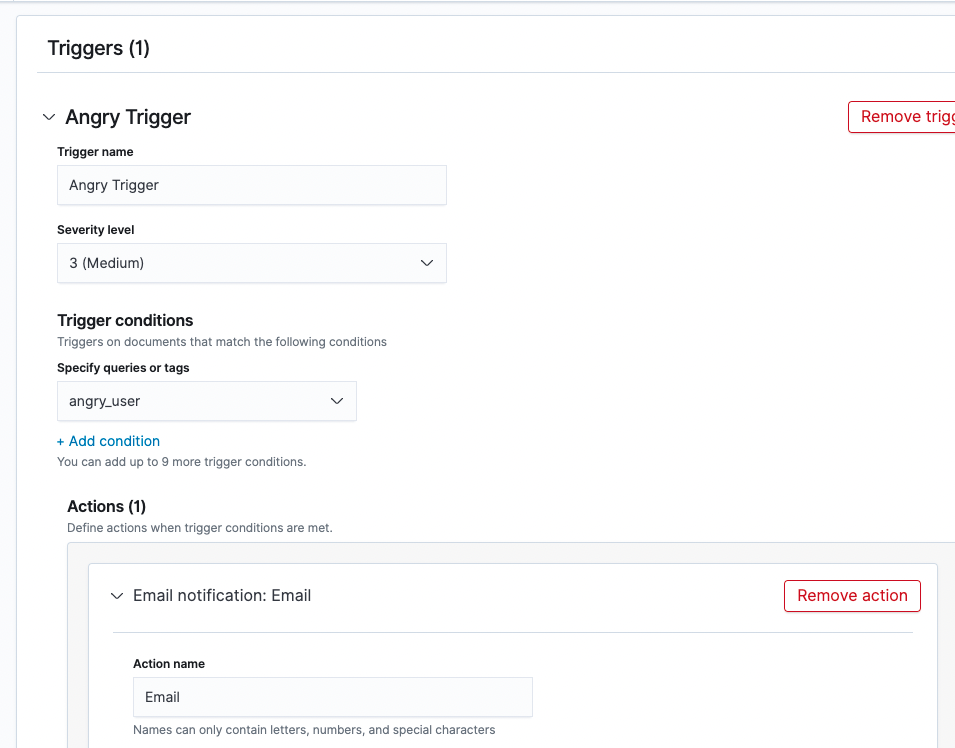
Now everytime a user with an “Angry” mood is created, or any other unique parameter you choose, an alert will be triggered. If you configured the email channel, you will receive this email by default:
Monitor angry_user just entered alert status. Please investigate the issue.
- Trigger: Angry Trigger
- Severity: 3
- Period start: 2022-06-20T16:34:34.220537459Z
- Period end: 2022-06-20T16:34:34.220539167Z
Conclusion
Alerts are a useful way to proactively notify users when something happens in their system. Alerts can be created based on many different criteria, from computed values in our data, to a per document basis, offering a lot of flexibility.
Additional notes
Elasticsearch and OpenSearch are both powerful search and analytics engines, but Elasticsearch has several key advantages. Elasticsearch boasts a more mature and feature-rich development history, translating to a better user experience, more features, and continuous optimizations. Our testing has consistently shown that Elasticsearch delivers faster performance while using fewer compute resources than OpenSearch. Additionally, Elasticsearch’s comprehensive documentation and active community forums provide invaluable resources for troubleshooting and further optimization. Elastic, the company behind Elasticsearch, offers dedicated support, ensuring enterprise-grade reliability and performance. These factors collectively make Elasticsearch a more versatile, efficient, and dependable choice for organizations requiring sophisticated search and analytics capabilities.