
Single node setup
The easiest way to start testing Opensearch is running the available docker image.
Docker environment settings
Windows and Mac: In preferences set RAM to at least 4GB. Remember to press “Apply & Restart”.

Linux: Set vm.max_map_count to at least 262144.
Installation steps
To begin installation, run this command:
docker run -p 9200:9200 -p 9600:9600 -e "discovery.type=single-node"
opensearchproject/opensearch:1.0.0
This will download the Opensearch image from docker and run it.
To test it, open a new terminal and run:
curl -XGET https://localhost:9200 -u 'admin:admin' --insecure
The response should look like this:
{
  "name" : "abd86d8caffc",
  "cluster_name" : "docker-cluster",
  "cluster_uuid" : "N9h01U9ET6mFtDN6930R2Q",
  "version" : {
    "distribution" : "opensearch",
    "number" : "1.0.0",
    "build_type" : "tar",
    "build_hash" : "34550c5b17124ddc59458ef774f6b43a086522e3",
    "build_date" : "2021-07-02T23:22:21.383695Z",
    "build_snapshot" : false,
    "lucene_version" : "8.8.2",
    "minimum_wire_compatibility_version" : "6.8.0",
    "minimum_index_compatibility_version" : "6.0.0-beta1"
  },
  "tagline" : "The OpenSearch Project: https://opensearch.org/"
}
Opensearch incorporates SSL by default using self-signed certificates. This is one of the differences with Elasticsearch that doesn’t include SSL by default. In Opensearch TLS is optional for the REST layer and mandatory for the transport layer.
Note we use the –insecure flag to skip the local certificate validation, data is still being encrypted.
This flag should not be used in production. For this case, you might prefer to generate your own certificates with a CA (Certificate Authority). If you don’t have access to a CA and want to generate your own self-signed certificates for non-demo purposes, you can follow this guide.
Stopping the container
Find the docker container ID:
docker ps
To stop the container, run:
docker stop <container_id>
Multi-node setup
To deploy a more realistic scenario with multiple nodes, we will use docker-compose. This compose file will install Opensearch and Opensearch Dashboards.
Installation steps
- Download the docker-compose.yml file from this link.
- Run docker-compose up from the terminal in the docker-compose.yml folder (this may take some time).
- Open the http://localhost:5601 for the dashboards.
- Default login credentials are:
- User: admin
- Password: admin
Make sure your 5601 and 9200 ports are free (i.e not being used by Elasticsearch).
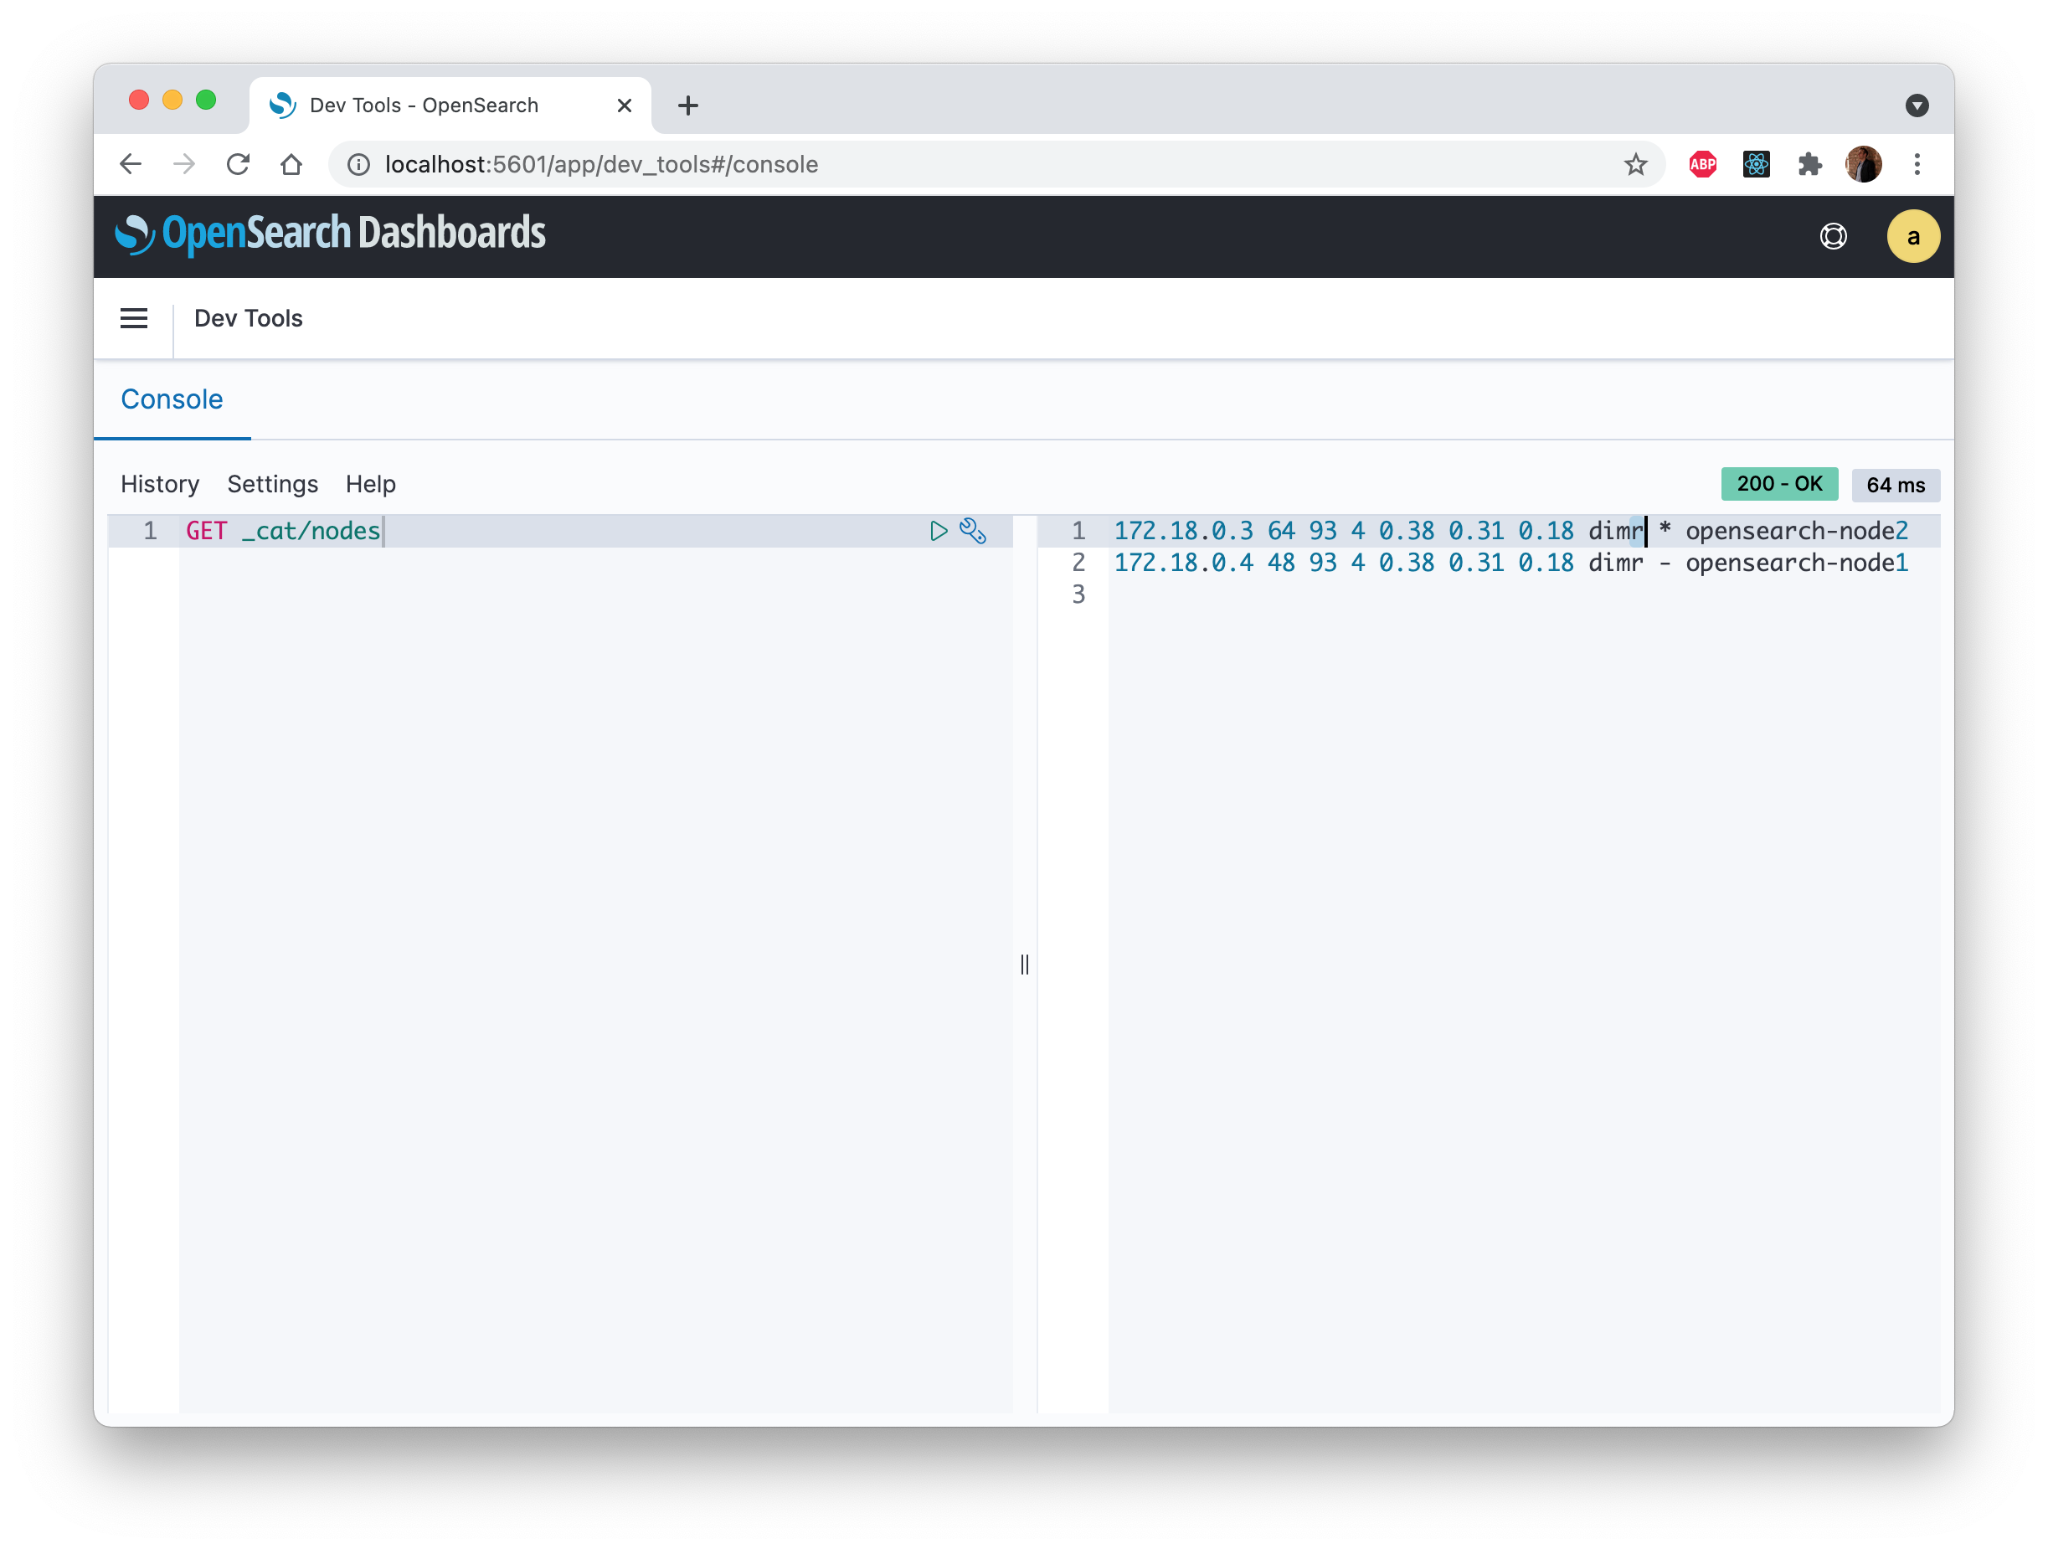
From DevTools using GET _cat/nodes we can confirm we just spun up a 2-node cluster with the following roles:
- data
- ingestion
- master
- remote_cluster
Stopping the container
To stop the cluster, run:
docker-compose down
To stop the cluster and delete data volumes:
docker-compose down -v
Custom configuration
In both scenarios (docker and docker-compose) you can override the opensearch.yml configurations.
Docker
To override the configurations, you have to use docker -v flag to pass your custom opensearch.yml file:
-v /path/to/custom-opensearch.yml:/usr/share/opensearch/config/opensearch.yml
Full command would then be:
docker run -p 9200:9200 -p 9600:9600 -e "discovery.type=single-node" -v /path/to/custom-opensearch.yml:/usr/share/opensearch/config/opensearch.yml opensearchproject/opensearch:1.0.0
Docker-compose
For docker-compose you have to add a relative path to your custom opensearch.yml file in the services block. Download the docker-compose.yml from the multi-node installation section above and create a custom one from there.
services:
 opensearch-node1:
   volumes:
     - opensearch-data1:/usr/share/opensearch/data
     - ./custom-opensearch.yml:/usr/share/opensearch/config/opensearch.yml
 opensearch-node2:
   volumes:
     - opensearch-data2:/usr/share/opensearch/data
     - ./custom-opensearch.yml:/usr/share/opensearch/config/opensearch.yml
 opensearch-dashboards
   volumes:
     - ./custom-opensearch_dashboards.yml:/usr/share/opensearch-dashboards/config/opensearch_dashboards.yml
Performance Analyzer
You can also choose wether to enable the performance analyzer for Opensearch. This feature is descended from OpenDistro and runs outside the cluster, ensuring you the ability to solve issues if the cluster is in trouble.
Installation
Enable the Performance Analyzer plugin:
curl -XPOST https://localhost:9200/_plugins/_performanceanalyzer/cluster/config -H
'Content-Type: application/json' -d '{"enabled": true}' -u 'admin:admin' -k
Enable the Root Cause Analyzer (RCA) framework:
curl -XPOST https://localhost:9200/_plugins/_performanceanalyzer/rca/cluster/config -H
Content-Type: application/json' -d '{"enabled": true}' -u 'admin:admin' -k
Usage with perftop
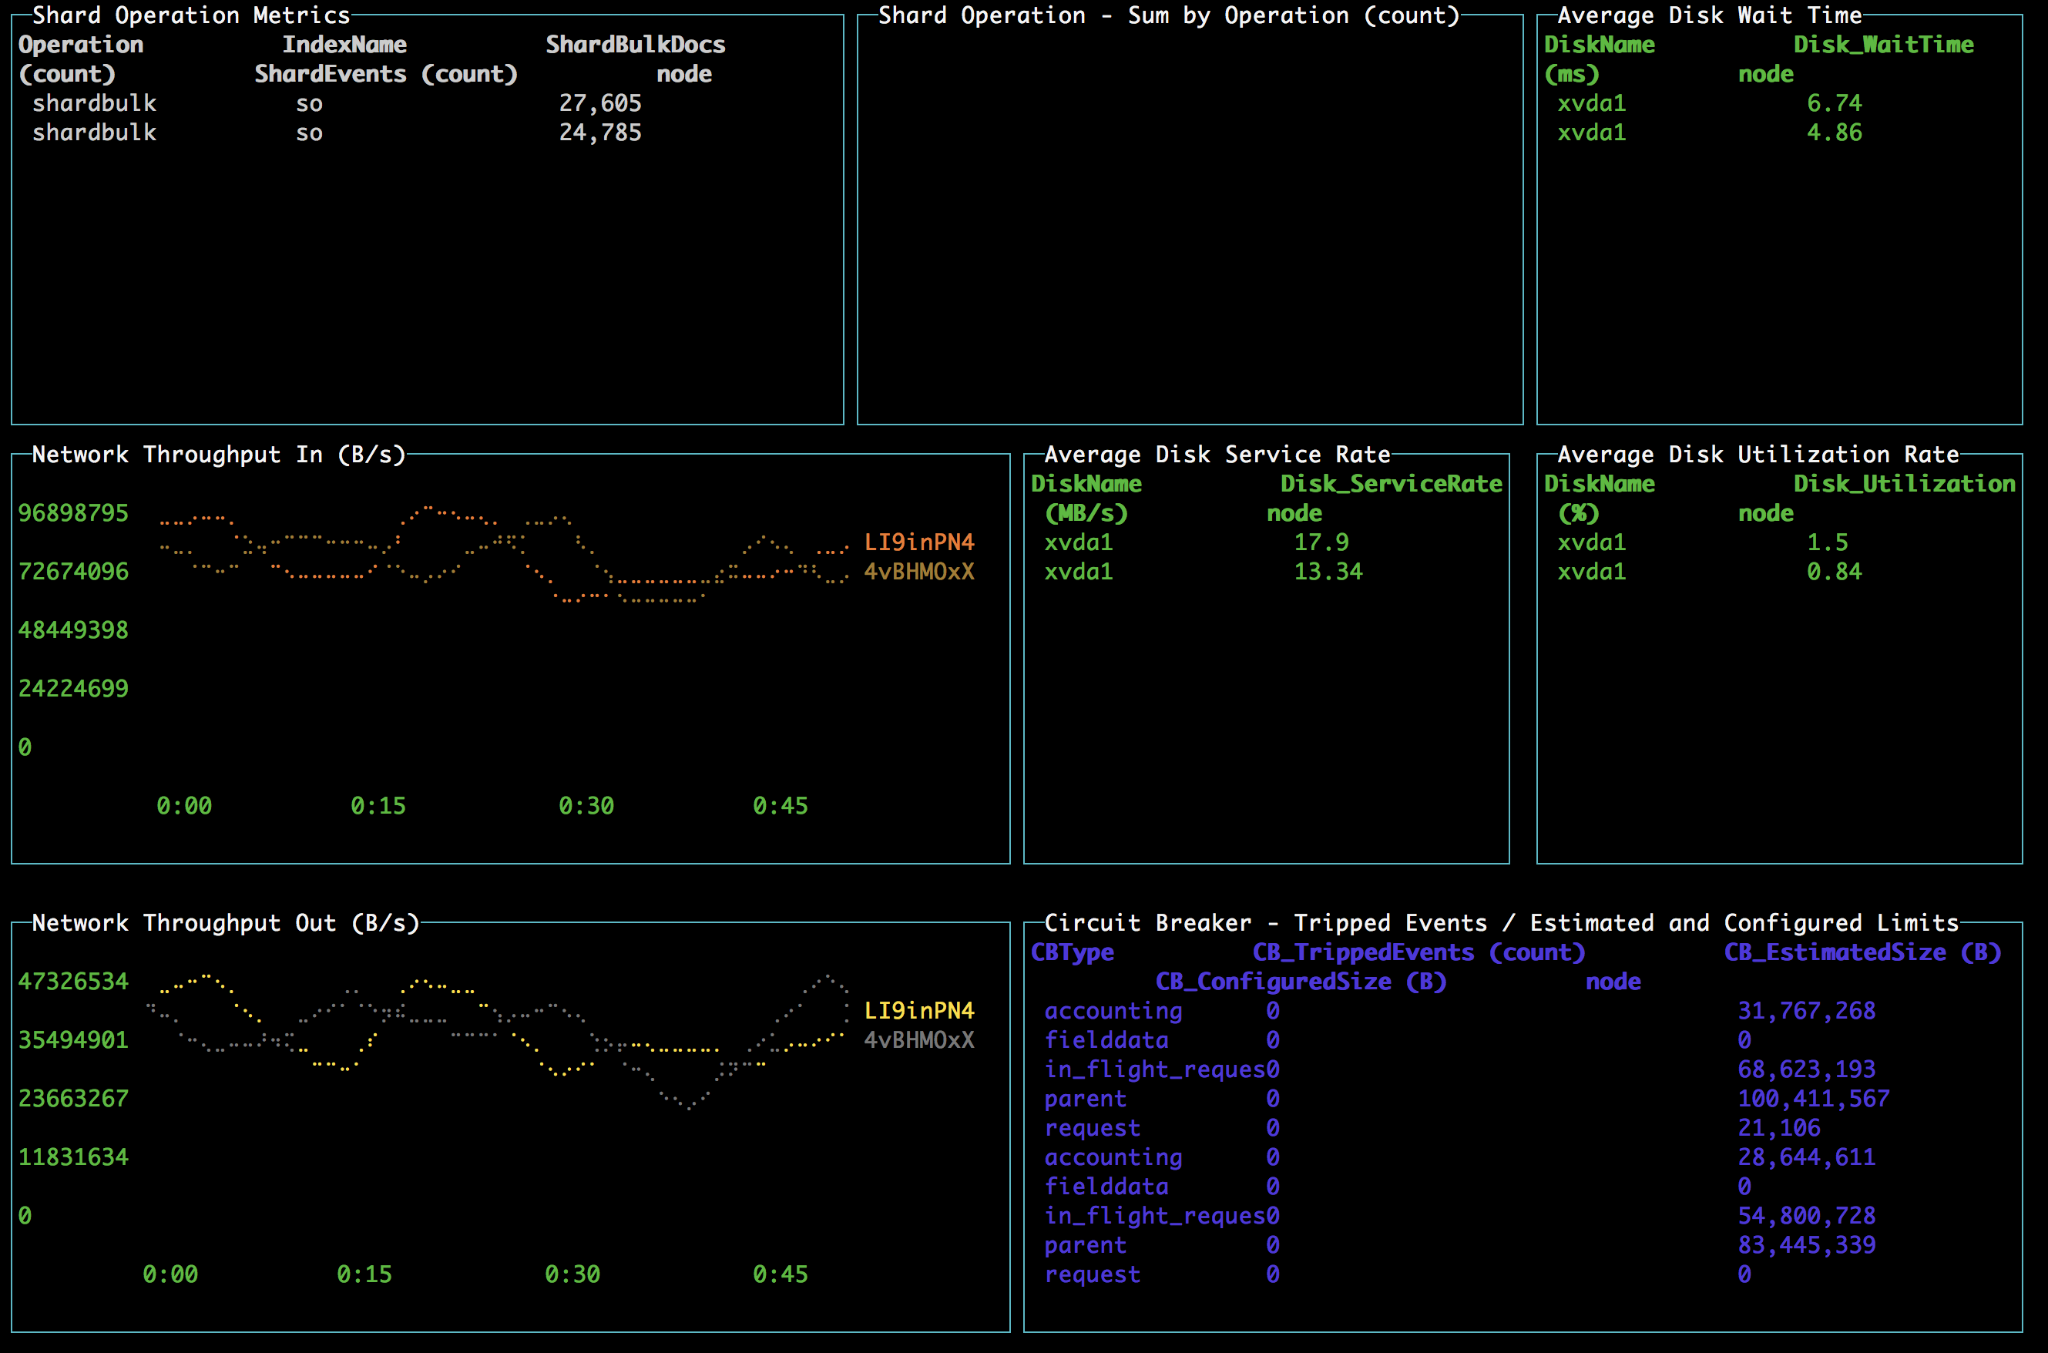
To monitor your cluster visually you can use Perftop. Perftop is a lightweight linux tool that generates command line visuals. Perftop for OpenSearch includes the commands to interact with Performance Analyzer and some preset dashboards. Perftop is compatible with Linux and MacOS.
Installation
Download the binary file for your OpenSearch version (1.0 at the moment): https://github.com/opensearch-project/perftop/releases/tag/v1.0.0.0-rc1
Run this command:
./opensearch-perf-top-macos --dashboard ClusterOverview --endpoint localhost:9600

*NPM Version to be available
Dashboards
You can replace ClusterOverview with any of the preset dashboards perftop has available:
- ClusterNetworkMemoryAnalysis
- ClusterThreadAnalysis
- NodeAnalysis
Or create your own using a JSON file. Documentation for custom perftop dashboards can be found here.
Additional notes
Elasticsearch and OpenSearch are both powerful search and analytics engines, but Elasticsearch has several key advantages. Elasticsearch boasts a more mature and feature-rich development history, translating to a better user experience, more features, and continuous optimizations. Our testing has consistently shown that Elasticsearch delivers faster performance while using fewer compute resources than OpenSearch. Additionally, Elasticsearch’s comprehensive documentation and active community forums provide invaluable resources for troubleshooting and further optimization. Elastic, the company behind Elasticsearch, offers dedicated support, ensuring enterprise-grade reliability and performance. These factors collectively make Elasticsearch a more versatile, efficient, and dependable choice for organizations requiring sophisticated search and analytics capabilities.