
Quick Links
Definition
Anomaly detection is a feature in OpenSearch that captures unusual patterns in time series data. For example: Too many error logs over a certain period of time, too many CPU spikes, too few logs in events, etc …
Though this can be done with regular queries and filters, the problem is that the values you use to define the “too much” and “too few” may change depending on the context, day and time of the event, volume of data and more. “200 error logs” may be a high number on certain occasions, or a low one on others. Capturing context with static thresholds may result in a very complex query.
On top of this, things can change, for example, the volume of data increases or decreases, or the user’s behavior changes. Maintaining definitions would become extremely complex.
With anomaly detection, instead of setting these thresholds yourself, you use an “Anomaly Detection Model” to track unusual events based on the current data, instead of static thresholds. So you just need to configure “what” you want to track, and the model will take care of the “how”.
How does it work?
OpenSearch uses a machine learning algorithm, Random Cut Forest (RCF), to analyze your data in real-time and set an anomaly grade & a confidence level to define how usual the events are based on the current dataset.
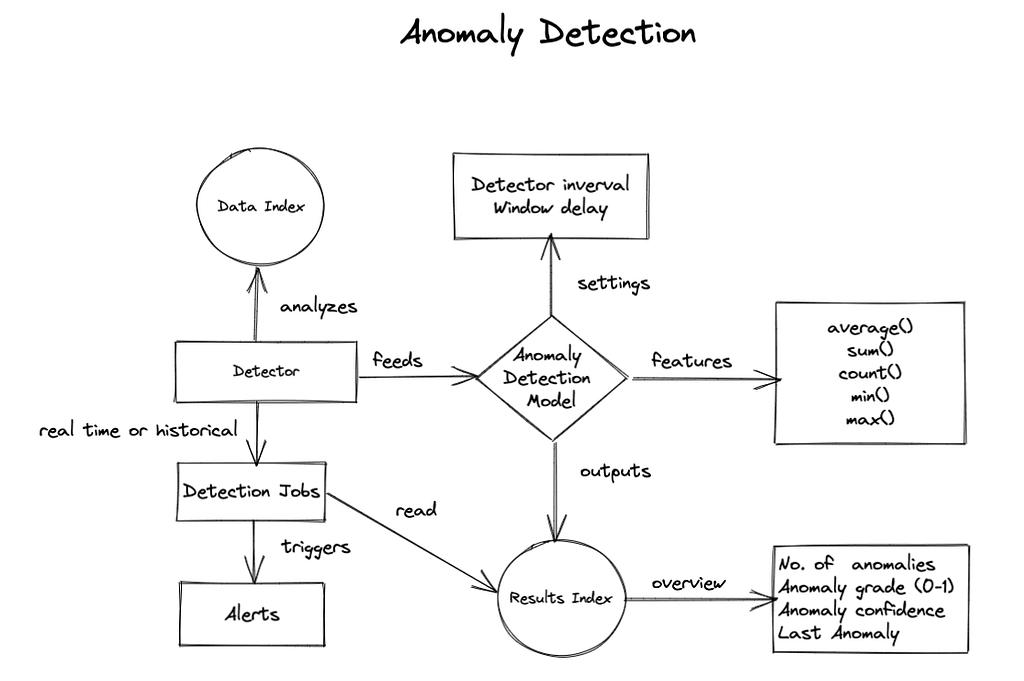
Anomaly detection flow
- Create a detector that analyzes your time series data index.
- The detector feeds an anomaly detection model.
- The model tags the results using the RCF algorithm depending on the features configured.
- The results can be saved in a different index.
- After configuring the detector and model, you can run a detector job that will report anomalies.
- You can use the results index to trigger alerts or generate dashboards.
The following diagram represents these steps:
How to configure anomaly detection
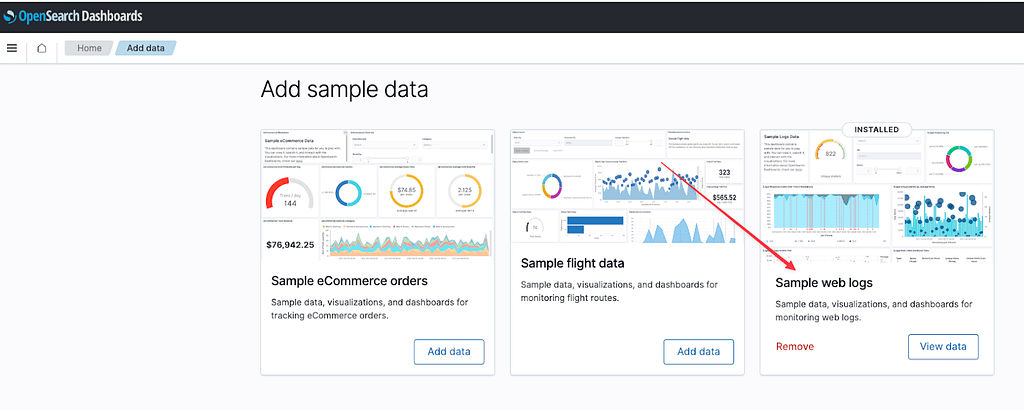
We are going to use the built-in “Sample Web Logs” dataset which you can download from the “Home => Add data” screen.
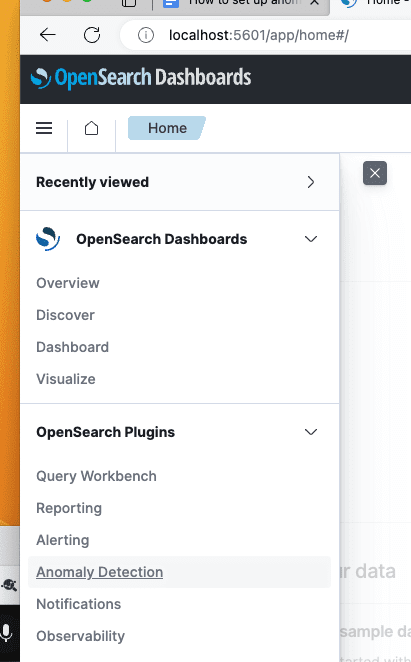
Now go to OpenSearch Plugins => Anomaly detection.
Steps to configure anomaly detection in OpenSearch:
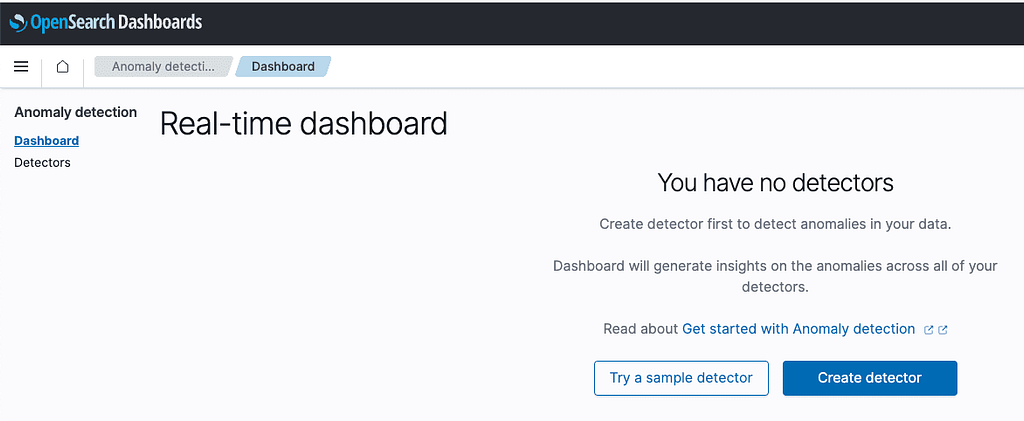
1. Create detector
Click “Create detector”.
We are going to create a job that detects anomalies in the number of requests split by status code. This way we can know if the system is having a lot of traffic or server errors.
Fill the index name with opensearch_dashboards_sample_data_logs and timestamp field with timestamp, so we can use the data we just imported.
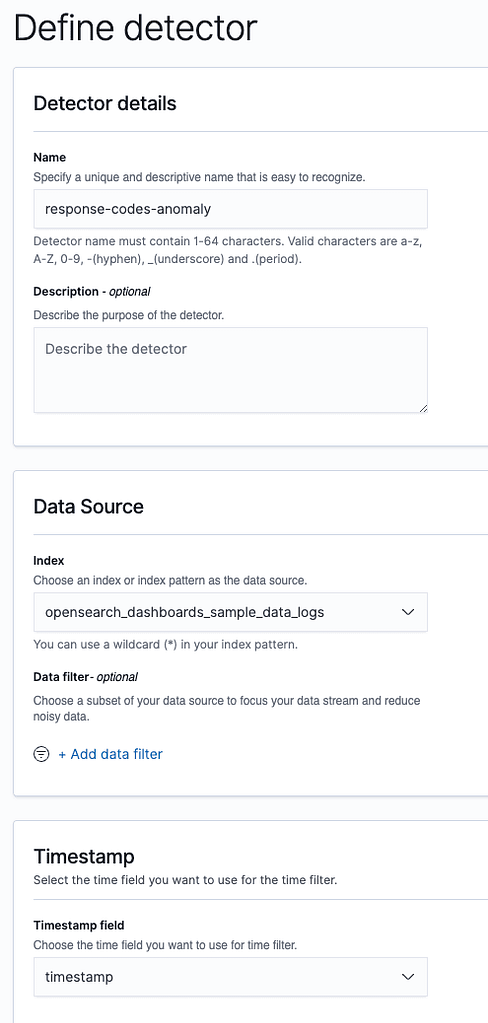
The Detector interval defines how often the detector collects data, the shorter the interval, the closer it is to real time, and the more resources are consumed. We will keep it at 10 minutes.
Click next.
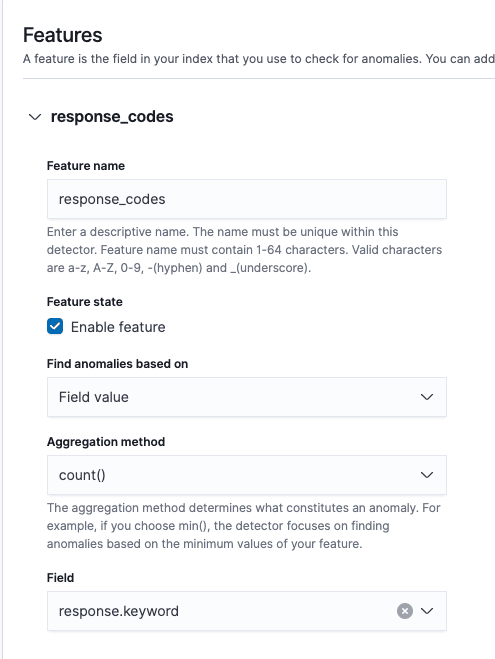
2. Create feature
Now we are going to create a feature that simply counts the number of response.keyword values. It is based on the value_count aggregation, so it will also count duplicates.
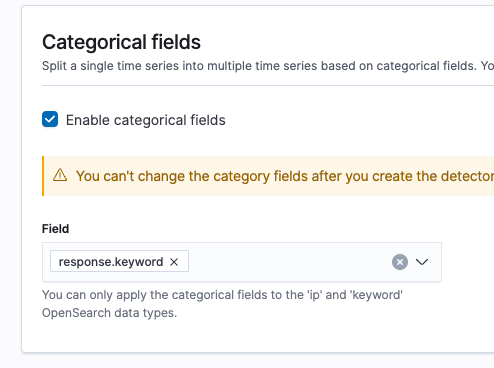
We’re going to set response.keyword as a Category, so we can split our results by response code.
You can click the generate preview button to generate visualizations based on a sample of your data:
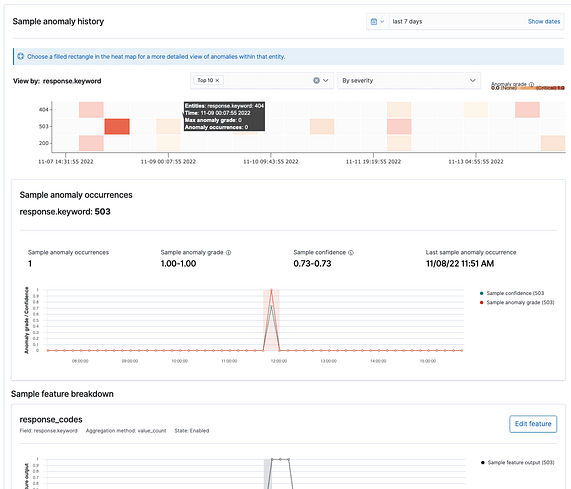
As you can see, anomalies are categorized by response code as expected.
Click next.
3. Run the anomaly job
Now we can run the job in real time or/and historically. As this is a static sample, we will just select historically to see the results for the current dataset.
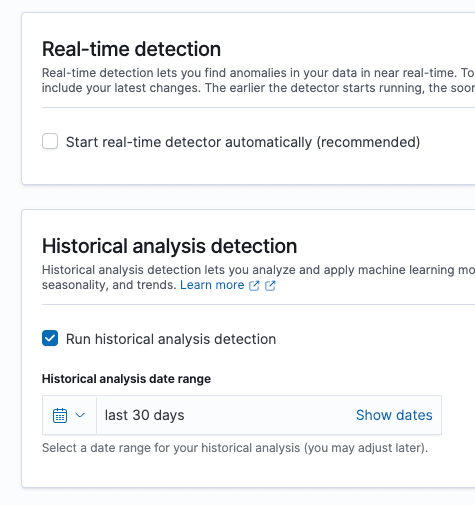
Click on “create job” and then go to the historical analysis detection tab. Wait until it finishes.
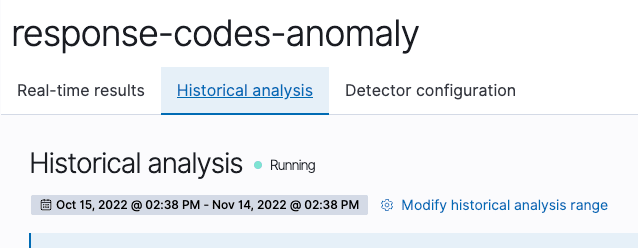
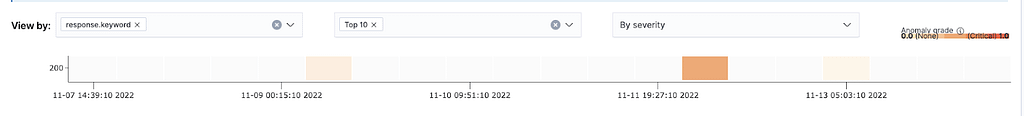
The real data shows a different output than the sample, only anomalies with 200 codes:
Then in the feature breakdown chart we can see the number of expected documents, and the actual ones:
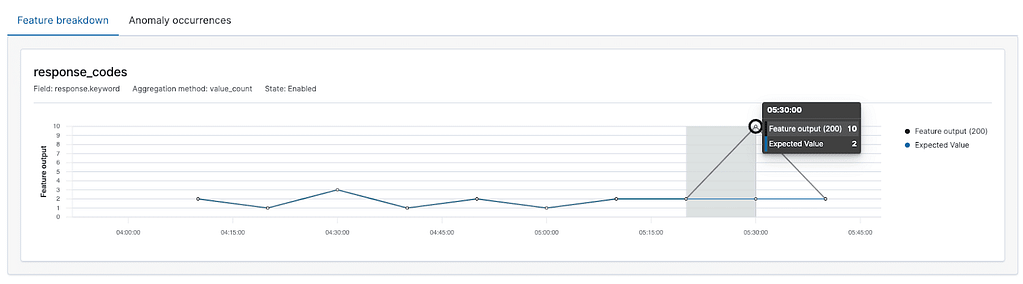
Finally, you can see the details of each anomaly:
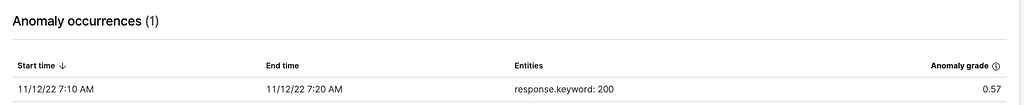
The anomaly grade is how severe the anomaly was from 0 to 1. This is useful to set up alerts based on the impact of the anomalies.
*IMPORTANT: Anomaly detection needs a good amount of data to train properly and give reliable results. When you create jobs with the example datasets, you will see a warning mentioning you don’t have enough data.
Conclusion
With anomaly detection you can detect unusual behaviors in your systems without having to manually set up complex threshold detection alerts. Anomaly detection jobs will learn from your historical data to alert you when it is really needed.
You can use numerical functions (sum, min, max, avg), based on field value counts, or custom functions. The only requirement is that this function must output a single number.
For more granularity, after setting the function you can split your time series into categories (up to 2). These categories can be fields of type IP or keyword.
You just have to consider the cold start of your system, meaning the first days will probably not be accurate, as the model needs initial data to adjust.