
Overview
The heap size is the amount of RAM allocated to the Java Virtual Machine of an Elasticsearch node.
As a general rule, you should set -Xms and -Xmx to the SAME value, which should be 50% of your total available RAM subject to a maximum of (approximately) 31GB.
A higher heap size will give your node more memory for indexing and search operations. However, your node also requires memory for caching, so using 50% maintains a healthy balance between the two. For this same reason in production you should avoid using other memory intensive processes on the same node as Elasticsearch.
Typically the heap usage will follow a saw tooth pattern, oscillating between around 30 and 70% of the maximum heap being used. This is because the JVM steadily increases heap usage percentage until the garbage collection process frees up memory again. High heap usage occurs when the garbage collection process cannot keep up. An indicator of high heap usage is when the garbage collection is incapable of reducing the heap usage to around 30%.
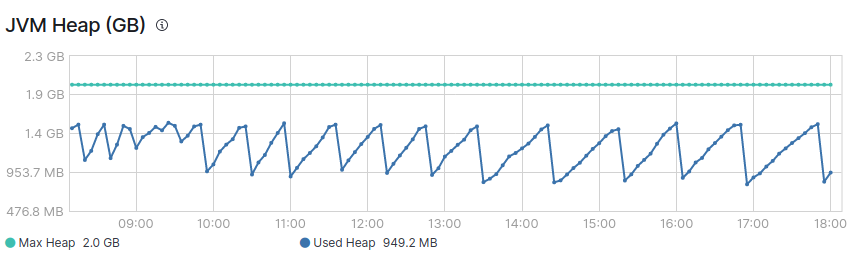
In the image above you can see normal sawtooth of JVM heap.
You will also see that there are two types of garbage collections, young and old GC.


In a healthy JVM, garbage collection should ideally meet the following conditions:
- Young GC is processed quickly (within 50 ms).
- Young GC is not frequently executed (about 10 seconds).
- Old GC is processed quickly (within 1 second).
- Old GC is not frequently executed (once per 10 minutes or more).
How to resolve when heap memory usage is too high or when JVM performance is not optimal
There can be a variety of reasons why heap memory usage can increase:
Oversharding
Please see the document on oversharding here.
Large aggregation sizes
In order to avoid large aggregation sizes, keep the number of aggregation buckets (size) in your queries to a minimum.
GET /_search
{
    "aggs" : {
        "products" : {
            "terms" : {
                "field" : "product",
                "size" : 5
                           }
        }
    }
}
You can use slow query logging (slow logs) and implement it on a specific index using the following.
PUT /my_index/_settings
{
    "index.search.slowlog.threshold.query.warn": "10s",
    "index.search.slowlog.threshold.query.info": "5s",
    "index.search.slowlog.threshold.query.debug": "2s",
    "index.search.slowlog.threshold.query.trace": "500ms",
    "index.search.slowlog.threshold.fetch.warn": "1s",
    "index.search.slowlog.threshold.fetch.info": "800ms",
    "index.search.slowlog.threshold.fetch.debug": "500ms",
    "index.search.slowlog.threshold.fetch.trace": "200ms",
    "index.search.slowlog.level": "info"
}
Queries that take a long time to return results are likely to be the resource-intensive ones.
Excessive bulk index size
If you are sending large requests then this can be a cause of high heap consumption. Try reducing the size of the bulk index requests.
Mapping issues
In particular, if you use “fielddata: true” then this can be a major user of your JVM heap.
Heap size incorrectly set
The heap size is defined by:
Setting the environment variable:
ES_JAVA_OPTS="-Xms2g -Xmx2g"
Editing the jvm.options file in your Elasticsearch configuration directory:
-Xms2g
-Xmx2g
The environmental variable setting takes priority over the file setting.
It is necessary to restart the node for the setting to be taken into account.
JVM new ratio incorrectly set
It is generally NOT necessary to set this, since Elasticsearch sets this value by default. This parameter defines the ratio of space available for “new generation” and “old generation” objects in the JVM.
If you see that old GC is becoming very frequent, you can try specifically setting this value in jvm.options file in your Elasticsearch config directory.
-XX:NewRatio=3“