
Quick links
Overview
The _disk_usage API was introduced in version 7.15 of Elasticsearch. It helps you get information about disk usage for each analyzed field of one or more indices and/or data streams.
Example of usage
Let’s explore this API by creating a test environment, indexing some data into it, and then running a couple of example queries to take a look at the results the API gives us back.
Bringing up a test environment with Docker
In order to create a test environment, we are going to use Docker. If you already have a test environment at your disposal, or if you prefer to create it some other way (like, for example, by running the binaries manually or creating a small deployment in Elastic Cloud), feel free to skip this section. Just bear in mind that you’ll need a cluster with at least version 7.15 to run the examples.
If you decide to follow along with this walkthrough, we assume that you have a Docker engine installed in your system. If you don’t, take a look at Docker’s installation page to find out how you can get it for your system.
If you do, then start by creating the following resources:
docker network create elastic

docker volume create esdata
You can then bring an Elasticsearch container up by running the command below. It will take a while to finish if it first needs to pull the image from the Docker repository, but that will happen only once. If you take a closer look at the command, you’ll see that we are mapping the volume we just created (so we can destroy this container and bring a new one up preserving all the data). We are also using the network we created, through which the Kibana container will communicate with the cluster. We are also running this instance as a single node and not a cluster, which should be enough for the purposes of this demo. Finally, we limited the amount of memory the service can allocate to 2GB:
docker run \
	--detach\
	--interactive \
	--tty \
	--restart always \
	--name elasticsearch \
	--network elastic \
	--volume esdata:/usr/share/elasticsearch/data \
	--publish 9200:9200 \
	--publish 9300:9300 \
	--env ES_JAVA_OPTS="-Xms2g -Xmx2g" \
	--env ES_SETTING_DISCOVERY_TYPE=single-node \
	--env ES_SETTING_CLUSTER_NAME=es \
	docker.elastic.co/elasticsearch/elasticsearch:8.6.2
You’ll have to wait until the service inside the container is up and running. You can do this by following the container’s logs and waiting for a message from Elasticsearch saying it’s ready to receive connections:
docker logs -f elasticsearch
Once you have that, the first thing you should do is reset the password for the elastic user. Run the command below and follow the instructions:
docker exec -it elasticsearch /usr/share/elasticsearch/bin/elasticsearch-reset-password -u elastic -i
Then test the connectivity with the cluster by running the command below and providing the newly created password. You should get a message like the one shown:
curl https://localhost:9200/ -k -u elastic


Enter host password for user 'elastic':
{
  "name" : "ac964fb09331",
  "cluster_name" : "es",
  "cluster_uuid" : "7Edx9d4PTq6l2W6Nq-UtbA",
  "version" : {
    "number" : "8.6.2",
    "build_flavor" : "default",
    "build_type" : "docker",
    "build_hash" : "2d58d0f136141f03239816a4e360a8d17b6d8f29",
    "build_date" : "2023-02-13T09:35:20.314882762Z",
    "build_snapshot" : false,
    "lucene_version" : "9.4.2",
    "minimum_wire_compatibility_version" : "7.17.0",
    "minimum_index_compatibility_version" : "7.0.0"
  },
  "tagline" : "You Know, for Search"
}
Now that you have an instance of Elasticsearch running, it’s time to bring a Kibana instance up. Run the command below:
docker run \
	--restart always \
	--interactive \
	--tty \
	--detach \
	--name kibana \
	--network elastic \
	--publish 5601:5601 \
	docker.elastic.co/kibana/kibana:8.6.2
The next thing you should do is check the container’s logs to get the public URL along with the access code generated by Kibana. Run the command below and get the URL, which should look like the one in the example:
docker logs kibana


...
i Kibana has not been configured.


Go to http://0.0.0.0:5601/?code=820824 to get started.
Almost there. You can now go to your web browser and go to that URL. You’ll get a form asking you to provide an enrollment token. This token is generated and printed out by Elasticsearch the first time the cluster is brought up. That’s OK, we can always generate a new token by running the command below:
docker exec -it elasticsearch bin/elasticsearch-create-enrollment-token --scope kibana


eyJ2ZXIiOiI4LjYuMiIsImFkciI6WyIxNzIuMTguMC4yOjkyMDAiXSwiZmdyIjoiNmNiMTQxNjIxMjJjZGQzMWVkMmRiOTY2ZjBmMTkzZjlmNjA1YTA0ZWY0NjE2MmI0Y2ZlNmE4NTg4NDY1NDVkZCIsImtleSI6Il9oYU9ENGNCM2hFSkNRNWctakR1OnB1bHNYb2ZoVDltQnhGenpxVndiWlEifQ==
Go back to your web browser and inform the generated token. If everything went correctly, you should now be able to log in with the elastic user and the password you reset.
Getting a dataset from Kaggle.com and indexing it in Elasticsearch
You should by now have a test environment available. If so, it’s time to put some data in it.
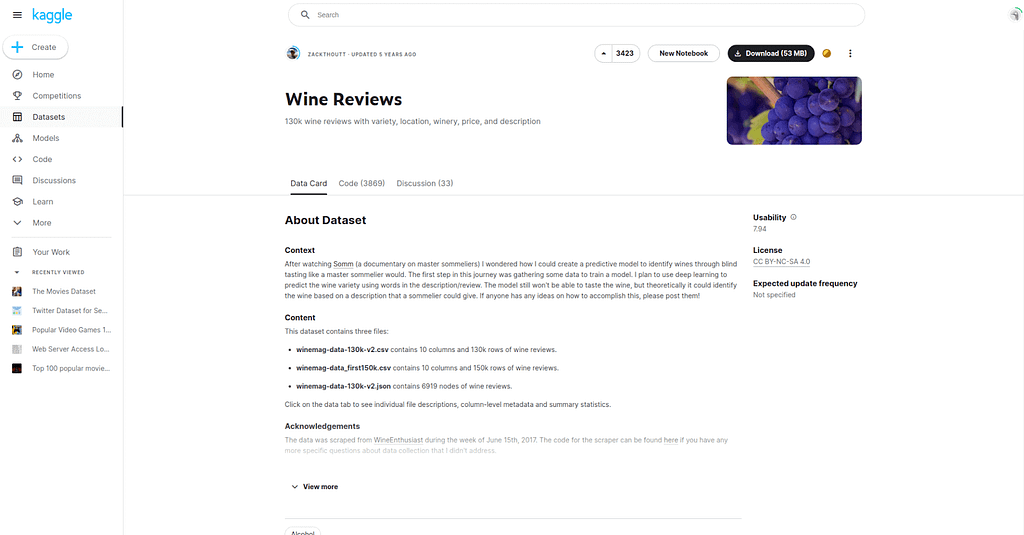
For the purpose of this demo, we are going to use a dataset available on the Kaggle.com website. If you don’t know Kaggle.com, it’s a very famous platform for people interested in topics like data science and machine learning. Users upload curated datasets so anyone can download and experiment with data analysis, algorithms, and so on. We are going to use the Wine Reviews dataset.
Go to the dataset’s page, download it, and extract it to some folder. It contains a couple of files, but we’ll only use the one called winemag-data-130k-v2.csv.
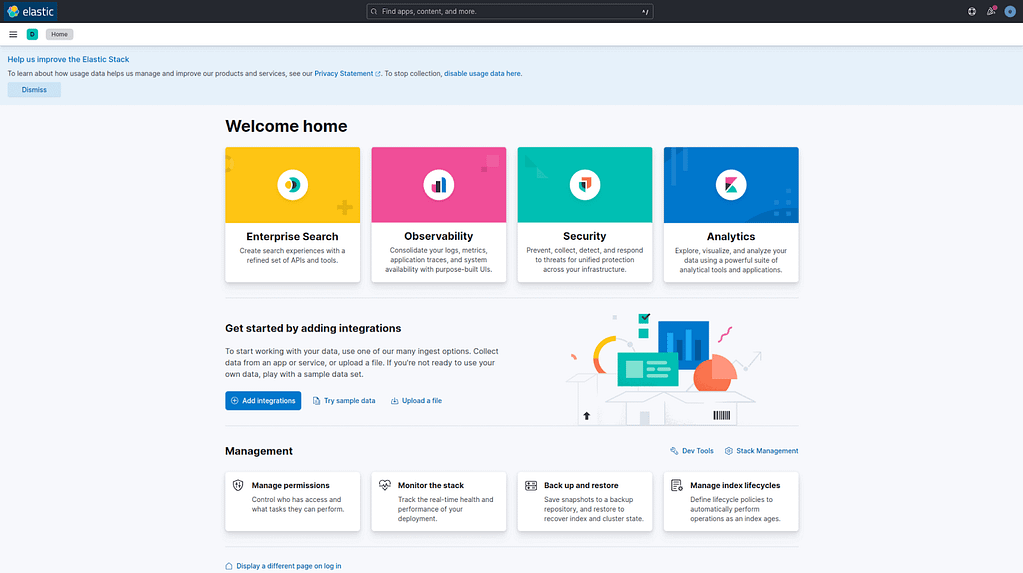
The easiest way to get this dataset into your Elasticsearch cluster is to use Kibana’s upload helper. Go to the homepage of your Kibana instance and look for the Upload a file option:
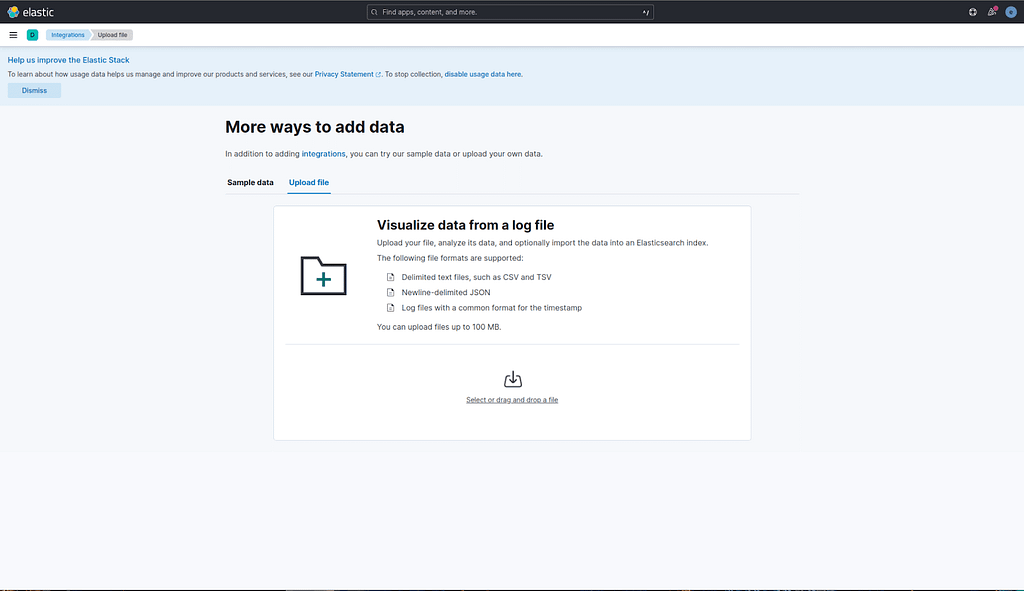
Then click on the Select or drag and drop a File option. Choose the winemag-data-130k-v2.csv file:
Kibana will analyze your file and give you the option to import it into your cluster. Click on the Import button available at the footer of the page:
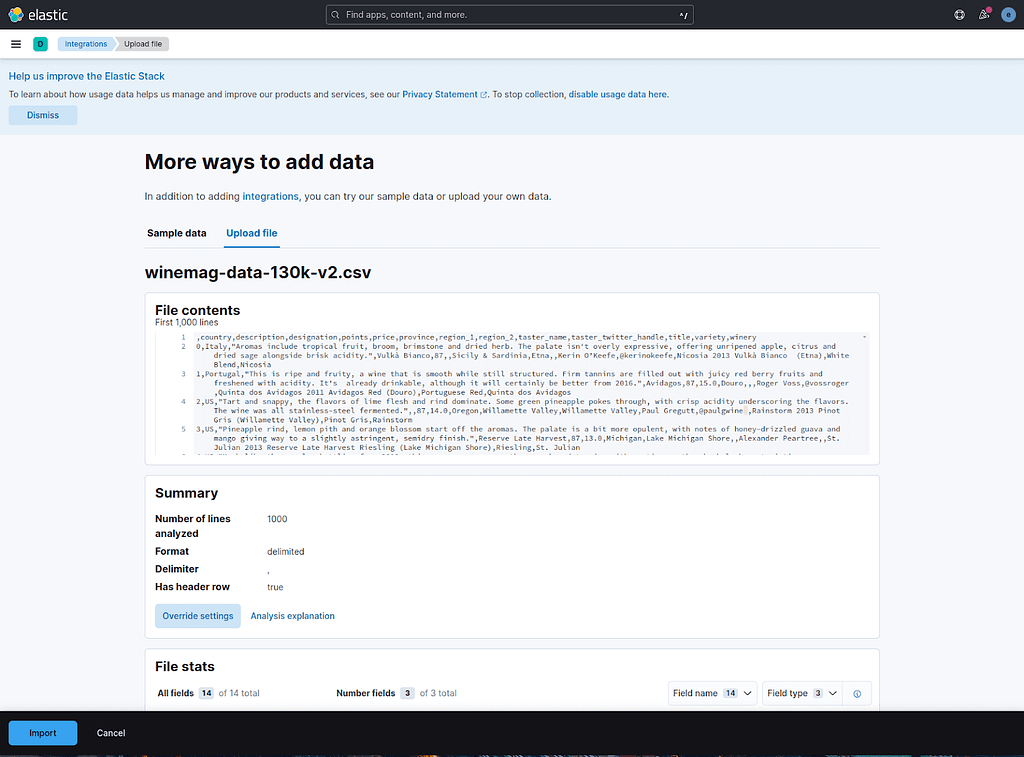
Kibana will ask you for an index name. Input winemag and click on the Import button:
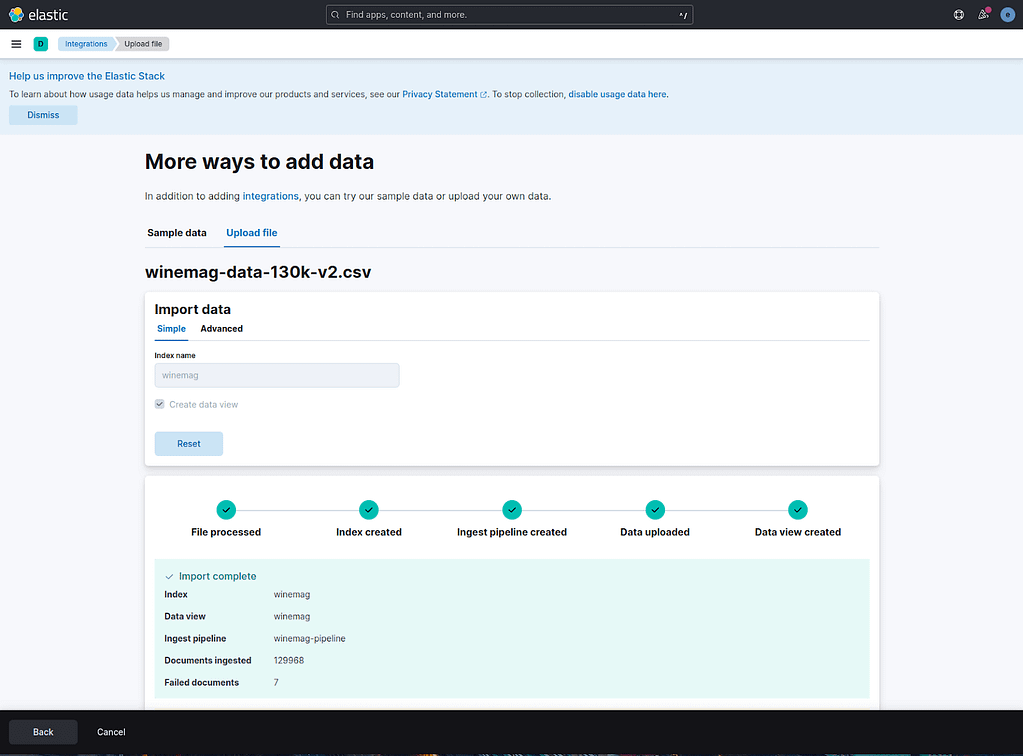
Kibana will inform you that 7 documents could not be imported, but that’s not a problem, the dataset still contains almost 130k other documents.
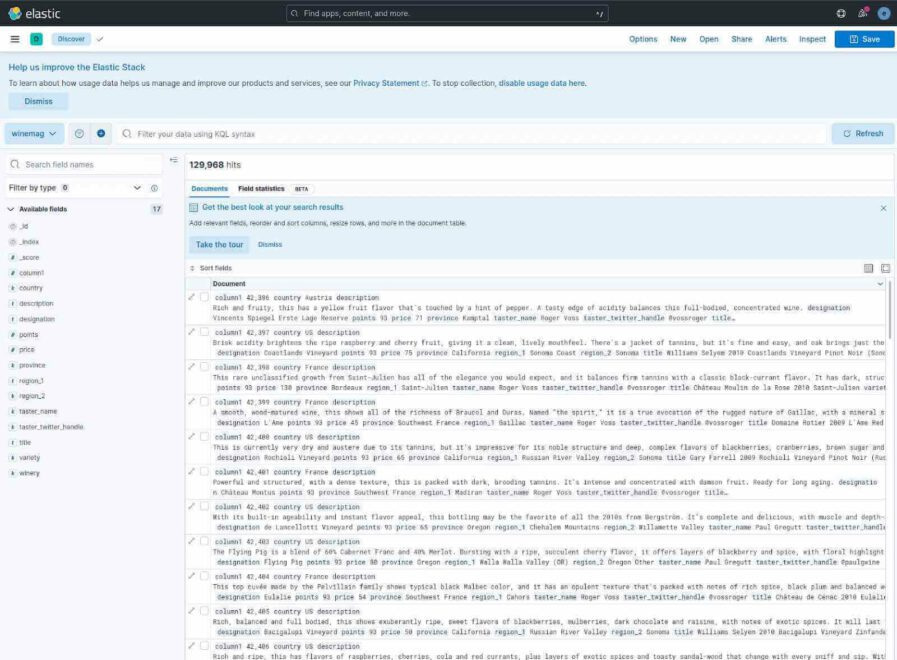
You can now take a look at your newly created index by going to the Discover app. From now on, we’ll mostly be working in the DevTools app.
Experimenting with the _disk_usage API
You should by now have a functional cluster with some data indexed to it. Let’s first run the _disk_usage API to see what the response looks like. Keep in mind that parts of the response were redacted for clearness.
POST winemag/_disk_usage?run_expensive_tasks=true


{
  "_shards": {
    "total": 1,
    "successful": 1,
    "failed": 0
  },
  "winemag": {
    "store_size": "55.3mb",
    "store_size_in_bytes": 58071202,
    "all_fields": {
      "total": "55.1mb",
      "total_in_bytes": 57832947,
      "inverted_index": {
        "total": "16.1mb",
        "total_in_bytes": 16979015
      },
      "stored_fields": "34.9mb",
      "stored_fields_in_bytes": 36608180,
      "doc_values": "2.8mb",
      "doc_values_in_bytes": 2947012,
      "points": "745.3kb",
      "points_in_bytes": 763240,
      "norms": "522.9kb",
      "norms_in_bytes": 535500,
      "term_vectors": "0b",
      "term_vectors_in_bytes": 0,
      "knn_vectors": "0b",
      "knn_vectors_in_bytes": 0
    },
    "fields": {
      "_id": {
        "total": "2.5mb",
        "total_in_bytes": 2659133,
        "inverted_index": {
          "total": "1001.9kb",
          "total_in_bytes": 1026007
        },
        "stored_fields": "1.5mb",
        "stored_fields_in_bytes": 1633126,
        "doc_values": "0b",
        "doc_values_in_bytes": 0,
        "points": "0b",
        "points_in_bytes": 0,
        "norms": "0b",
        "norms_in_bytes": 0,
        "term_vectors": "0b",
        "term_vectors_in_bytes": 0,
        "knn_vectors": "0b",
        "knn_vectors_in_bytes": 0
      },
      "_primary_term": {
        "total": "0b",
        "total_in_bytes": 0,
        "inverted_index": {
          "total": "0b",
          "total_in_bytes": 0
        },
        "stored_fields": "0b",
        "stored_fields_in_bytes": 0,
        "doc_values": "0b",
        "doc_values_in_bytes": 0,
        "points": "0b",
        "points_in_bytes": 0,
        "norms": "0b",
        "norms_in_bytes": 0,
        "term_vectors": "0b",
        "term_vectors_in_bytes": 0,
        "knn_vectors": "0b",
        "knn_vectors_in_bytes": 0
      },
      "_seq_no": {
        "total": "400.6kb",
        "total_in_bytes": 410231,
        "inverted_index": {
          "total": "0b",
          "total_in_bytes": 0
        },
        "stored_fields": "0b",
        "stored_fields_in_bytes": 0,
        "doc_values": "250kb",
        "doc_values_in_bytes": 256085,
        "points": "150.5kb",
        "points_in_bytes": 154146,
        "norms": "0b",
        "norms_in_bytes": 0,
        "term_vectors": "0b",
        "term_vectors_in_bytes": 0,
        "knn_vectors": "0b",
        "knn_vectors_in_bytes": 0
      },
      "_source": {
        "total": "33.3mb",
        "total_in_bytes": 34975054,
        "inverted_index": {
          "total": "0b",
          "total_in_bytes": 0
        },
        "stored_fields": "33.3mb",
        "stored_fields_in_bytes": 34975054,
        "doc_values": "0b",
        "doc_values_in_bytes": 0,
        "points": "0b",
        "points_in_bytes": 0,
        "norms": "0b",
        "norms_in_bytes": 0,
        "term_vectors": "0b",
        "term_vectors_in_bytes": 0,
        "knn_vectors": "0b",
        "knn_vectors_in_bytes": 0
      },
      "_version": {
        "total": "0b",
        "total_in_bytes": 0,
        "inverted_index": {
          "total": "0b",
          "total_in_bytes": 0
        },
        "stored_fields": "0b",
        "stored_fields_in_bytes": 0,
        "doc_values": "0b",
        "doc_values_in_bytes": 0,
        "points": "0b",
        "points_in_bytes": 0,
        "norms": "0b",
        "norms_in_bytes": 0,
        "term_vectors": "0b",
        "term_vectors_in_bytes": 0,
        "knn_vectors": "0b",
        "knn_vectors_in_bytes": 0
      },
      "column1": {
        "total": "400.6kb",
        "total_in_bytes": 410235,
        "inverted_index": {
          "total": "0b",
          "total_in_bytes": 0
        },
        "stored_fields": "0b",
        "stored_fields_in_bytes": 0,
        "doc_values": "250kb",
        "doc_values_in_bytes": 256085,
        "points": "150.5kb",
        "points_in_bytes": 154150,
        "norms": "0b",
        "norms_in_bytes": 0,
        "term_vectors": "0b",
        "term_vectors_in_bytes": 0,
        "knn_vectors": "0b",
        "knn_vectors_in_bytes": 0
      },
      "country": {
        "total": "258.5kb",
        "total_in_bytes": 264754,
        "inverted_index": {
          "total": "95.1kb",
          "total_in_bytes": 97448
        },
        "stored_fields": "0b",
        "stored_fields_in_bytes": 0,
        "doc_values": "163.3kb",
        "doc_values_in_bytes": 167306,
        "points": "0b",
        "points_in_bytes": 0,
        "norms": "0b",
        "norms_in_bytes": 0,
        "term_vectors": "0b",
        "term_vectors_in_bytes": 0,
        "knn_vectors": "0b",
        "knn_vectors_in_bytes": 0
      },
      "description": {
        "total": "10mb",
        "total_in_bytes": 10533932,
        "inverted_index": {
          "total": "9.9mb",
          "total_in_bytes": 10403964
        },
        "stored_fields": "0b",
        "stored_fields_in_bytes": 0,
        "doc_values": "0b",
        "doc_values_in_bytes": 0,
        "points": "0b",
        "points_in_bytes": 0,
        "norms": "126.9kb",
        "norms_in_bytes": 129968,
        "term_vectors": "0b",
        "term_vectors_in_bytes": 0,
        "knn_vectors": "0b",
        "knn_vectors_in_bytes": 0
      },
      {...},
      "title": {
        "total": "2.8mb",
        "total_in_bytes": 2939381,
        "inverted_index": {
          "total": "2.6mb",
          "total_in_bytes": 2809413
        },
        "stored_fields": "0b",
        "stored_fields_in_bytes": 0,
        "doc_values": "0b",
        "doc_values_in_bytes": 0,
        "points": "0b",
        "points_in_bytes": 0,
        "norms": "126.9kb",
        "norms_in_bytes": 129968,
        "term_vectors": "0b",
        "term_vectors_in_bytes": 0,
        "knn_vectors": "0b",
        "knn_vectors_in_bytes": 0
      },
      "variety": {
        "total": "382.6kb",
        "total_in_bytes": 391786,
        "inverted_index": {
          "total": "171.1kb",
          "total_in_bytes": 175208
        },
        "stored_fields": "0b",
        "stored_fields_in_bytes": 0,
        "doc_values": "211.5kb",
        "doc_values_in_bytes": 216578,
        "points": "0b",
        "points_in_bytes": 0,
        "norms": "0b",
        "norms_in_bytes": 0,
        "term_vectors": "0b",
        "term_vectors_in_bytes": 0,
        "knn_vectors": "0b",
        "knn_vectors_in_bytes": 0
      },
      "winery": {
        "total": "1.2mb",
        "total_in_bytes": 1262559,
        "inverted_index": {
          "total": "683.6kb",
          "total_in_bytes": 700031
        },
        "stored_fields": "0b",
        "stored_fields_in_bytes": 0,
        "doc_values": "549.3kb",
        "doc_values_in_bytes": 562528,
        "points": "0b",
        "points_in_bytes": 0,
        "norms": "0b",
        "norms_in_bytes": 0,
        "term_vectors": "0b",
        "term_vectors_in_bytes": 0,
        "knn_vectors": "0b",
        "knn_vectors_in_bytes": 0
      }
    }
  }
}
Notice that we had to include the parameter run_expensive_tasks set to true in the request in order to have Elasticsearch accept and execute it. That is because this API is very resource intensive, and you should be aware of that and confirm that you still want it to execute. The default value for this parameter is false, that’s why you must include it and set it to true in every request you make to this API.
As you can see, the response will list every index you included in your request (you can use this API against many indices, just be aware that this is not recommended) and then for each index, it will list its fields and give some statistics.
You can also limit the API response by filtering one specific field path. In the example below, we are calling the API filtering the field “description”, and that’s what we’ll focus on for the rest of our demo so we can compare the different results we’ll get.
POST winemag/_disk_usage?run_expensive_tasks=true&filter_path=*.fields.description


{
  "winemag": {
    "fields": {
      "description": {
        "total": "10mb",
        "total_in_bytes": 10533932,
        "inverted_index": {
          "total": "9.9mb",
          "total_in_bytes": 10403964
        },
        "stored_fields": "0b",
        "stored_fields_in_bytes": 0,
        "doc_values": "0b",
        "doc_values_in_bytes": 0,
        "points": "0b",
        "points_in_bytes": 0,
        "norms": "126.9kb",
        "norms_in_bytes": 129968,
        "term_vectors": "0b",
        "term_vectors_in_bytes": 0,
        "knn_vectors": "0b",
        "knn_vectors_in_bytes": 0
      }
    }
  }
}
Now that we know how the API works, let’s try to tweak our data so we can get different results. The API calculates the disk usage of each of the index’s fields. Unsurprisingly, one aspect that will directly influence the amount of storage the analyzed field uses is the analyzer that was configured for the field. So far, we haven’t configured anything special related to text analysis, so our dataset was indexed using Elasticsearch’s default settings. If you don’t set a custom analyzer, Elasticsearch will index your text field using the standard analyzer. That was the analyzer used to index all of our dataset’s text fields.
With that in mind, what we have to do is reindex our index to another one, but this time using a different analyzer. We’ll then see if we really get different results.
Let’s begin by creating a new index that uses the keyword analyzer as its default analyzer. This analyzer is said to be a noop in Elasticsearch’s analysis process, which means that the text submitted to this analyzer will come out exactly the same after the analysis process. Usually, that’s not what you want for a text field like our “description” field. This is the typical field that should definitely be the object of a more sophisticated analyzer so we can build elaborate queries on top of it. But for the purpose of our demo (which is simply to check if different analyzers demand different disk usage), it will do.
PUT winemag-keyword-analyzer
{
  "settings": {
    "analysis": {
      "analyzer": {
        "default": {
          "type": "keyword"
        }
      }
    }
  }
}
Now we can reindex the originally indexed dataset into this newly created index:
POST _reindex
{
  "source": {
    "index": "winemag"
  },
  "dest": {
    "index": "winemag-keyword-analyzer"
  }
}
Let’s see if we already get different results with the _disk_usage API:
POST winemag-keyword-analyzer/_disk_usage?run_expensive_tasks=true&filter_path=*.fields.description


{
  "winemag-keyword-analyzer": {
    "fields": {
      "description": {
        "total": "21.7mb",
        "total_in_bytes": 22782053,
        "inverted_index": {
          "total": "21.7mb",
          "total_in_bytes": 22782053
        },
        "stored_fields": "0b",
        "stored_fields_in_bytes": 0,
        "doc_values": "0b",
        "doc_values_in_bytes": 0,
        "points": "0b",
        "points_in_bytes": 0,
        "norms": "0b",
        "norms_in_bytes": 0,
        "term_vectors": "0b",
        "term_vectors_in_bytes": 0,
        "knn_vectors": "0b",
        "knn_vectors_in_bytes": 0
      }
    }
  }
}
And we definitely did. The total disk usage of the “description” field went from 10MB to almost 22MB. That’s probably because the field was not analyzed so Elasticsearch didn’t have the chance to, for example, break the text into tokens and then remove stopwords. Every text that went in was stored as it was.
Let’s do the same process now for the simple and english analyzers:
PUT winemag-simple-analyzer
{
  "settings": {
    "analysis": {
      "analyzer": {
        "default": {
          "type": "simple"
        }
      }
    }
  }
}


POST _reindex
{
  "source": {
    "index": "winemag"
  },
  "dest": {
    "index": "winemag-simple-analyzer"
  }
}


PUT winemag-english-analyzer
{
  "settings": {
    "analysis": {
      "analyzer": {
        "default": {
          "type": "english"
        }
      }
    }
  }
}


POST _reindex
{
  "source": {
    "index": "winemag"
  },
  "dest": {
    "index": "winemag-english-analyzer"
  }
}
Finally, now that we have our dataset indexed into Elasticsearch using four different analyzers, let’s compare the disk usage results of the “description” field in every one of the indices that we’ve created:
POST winemag*/_disk_usage?run_expensive_tasks=true&filter_path=*.fields.description


{
  "winemag": {
    "fields": {
      "description": {
        "total": "10mb",
        "total_in_bytes": 10533932,
        "inverted_index": {
          "total": "9.9mb",
          "total_in_bytes": 10403964
        },
        "stored_fields": "0b",
        "stored_fields_in_bytes": 0,
        "doc_values": "0b",
        "doc_values_in_bytes": 0,
        "points": "0b",
        "points_in_bytes": 0,
        "norms": "126.9kb",
        "norms_in_bytes": 129968,
        "term_vectors": "0b",
        "term_vectors_in_bytes": 0,
        "knn_vectors": "0b",
        "knn_vectors_in_bytes": 0
      }
    }
  },
  "winemag-english-analyzer": {
    "fields": {
      "description": {
        "total": "7.6mb",
        "total_in_bytes": 8066763,
        "inverted_index": {
          "total": "7.5mb",
          "total_in_bytes": 7936795
        },
        "stored_fields": "0b",
        "stored_fields_in_bytes": 0,
        "doc_values": "0b",
        "doc_values_in_bytes": 0,
        "points": "0b",
        "points_in_bytes": 0,
        "norms": "126.9kb",
        "norms_in_bytes": 129968,
        "term_vectors": "0b",
        "term_vectors_in_bytes": 0,
        "knn_vectors": "0b",
        "knn_vectors_in_bytes": 0
      }
    }
  },
  "winemag-keyword-analyzer": {
    "fields": {
      "description": {
        "total": "21.7mb",
        "total_in_bytes": 22782053,
        "inverted_index": {
          "total": "21.7mb",
          "total_in_bytes": 22782053
        },
        "stored_fields": "0b",
        "stored_fields_in_bytes": 0,
        "doc_values": "0b",
        "doc_values_in_bytes": 0,
        "points": "0b",
        "points_in_bytes": 0,
        "norms": "0b",
        "norms_in_bytes": 0,
        "term_vectors": "0b",
        "term_vectors_in_bytes": 0,
        "knn_vectors": "0b",
        "knn_vectors_in_bytes": 0
      }
    }
  },
  "winemag-simple-analyzer": {
    "fields": {
      "description": {
        "total": "10.1mb",
        "total_in_bytes": 10594855,
        "inverted_index": {
          "total": "9.9mb",
          "total_in_bytes": 10464887
        },
        "stored_fields": "0b",
        "stored_fields_in_bytes": 0,
        "doc_values": "0b",
        "doc_values_in_bytes": 0,
        "points": "0b",
        "points_in_bytes": 0,
        "norms": "126.9kb",
        "norms_in_bytes": 129968,
        "term_vectors": "0b",
        "term_vectors_in_bytes": 0,
        "knn_vectors": "0b",
        "knn_vectors_in_bytes": 0
      }
    }
  }
}
We can see that the index that uses the english analyzer is the one using less disk, probably because it’s a more sophisticated and specialized analyzer that also includes a more comprehensive list of stopwords.
Things to be aware of
Now that you know what the _disk_usage API is used for, there are a couple of things you should be aware of before deciding to use it in your production environment.
First of all, as of version 7.15, this feature is still considered a technical preview, meaning that it is not generally available and thus not subject to Elastic’s support SLA conditions. Keep in mind that this feature could even be completely removed from the API.
Second, indices created in some previous versions of Elasticsearch might not be supported by this API. In its official documentation, Elastic doesn’t clarify which versions are supported and which are not, so it would be better to consider that the API should only be used with indices created in a cluster that was running 8.6 or newer versions.
Third, the official documentation page for this API also mentions that the results for small indices can be inaccurate because some parts of the index might not be analyzed by the API. Again, Elastic doesn’t clarify what the thresholds would be for considering an index small for the purposes of using this API against it.
Fourth, as mentioned above, the API is quite resource intensive, so it should always be run with the run_expensive_tasks set to true (it defaults to false). Elasticsearch will actually not allow you to run it otherwise and will produce the error shown below:
POST winemag-data-130k-v2/_disk_usage?run_expensive_tasks=false


{
  "error": {
    "root_cause": [
      {
        "type": "illegal_argument_exception",
        "reason": "analyzing the disk usage of an index is expensive and resource-intensive, the parameter [run_expensive_tasks] must be set to [true] in order for the task to be performed."
      }
    ],
    "type": "illegal_argument_exception",
    "reason": "analyzing the disk usage of an index is expensive and resource-intensive, the parameter [run_expensive_tasks] must be set to [true] in order for the task to be performed."
  },
  "status": 400
}
Finally, because the API is significantly resource intensive, it is recommended that it should be run with only one index as the target, even though it does accept a list of indices as targets (we actually ran it against a list of indices in our last example, but that’s OK since we were only experimenting with the API). If you do run it against a couple of indices, expect performance issues.
Conclusion
In this demo, we tried to simulate a scenario where we had different versions of an index, each one with different settings, more specifically each one using a different analyzer, which is something that we know can/will influence how much storage a field of the index will use.
The _disk_usage API helps you investigate how much storage each field demands so you can decide which ones could maybe be refactored (e.g., by changing the analysis process) or even got rid of to save some disk space if you know that they are not being queried.