
Background
Opster incorporates deep knowledge learned first-hand by some of the best Elasticsearch experts around the world. This troubleshooting guide is based on our very own Elasticsearch expert’s first-hand encounter with a burst of search traffic and focuses on how the correct configuration of primary shards and replicas can help ES handle such cases. If you want a basic intro to shards and replicas, read this.
Quick page navigation:
Troubleshooting guide
Troubleshooting actions
Tips and takeaways
FAQ

Sometimes a service will receive a huge amount of search traffic all at once, perhaps due to a certain event (for instance, a Black Friday sale on an eCommerce site) or due to some DDoS attack. When legitimate traffic occurs, the search system and services are expected to work within SLA. There are several circumstances in which a sudden spike of legitimate search traffic (searching and indexing) could happen sporadically.
When you run a production ES cluster, it’s normally integrated with some infrastructure monitoring tools, log analysis tools, traffic analysis tools, etc., in order to help in the debugging of production issues. Even though these traditional tools were implemented in the case study below, it took the team a significant amount of time to get to the root cause of the issue.
Outage description
In the case in question, our Elasticsearch expert encountered a company experiencing multiple events that had caused too many search queries, which in turn resulted in degraded search performance.
The system hosted multiple service indices on the same ES cluster (multi-tenant ES cluster). The ES cluster on which the search index was hosted had been underutilized before the event and cluster metrics like CPU and memory usage for the prior 15 days were well below 40%. The incident began when a service team was informed of a huge traffic increase (~5x) on one search functionality. During the event, users started experiencing slow searches and there were also high CPU alerts on the cluster. This also affected the performance of other indices that were hosted on the same cluster.
Increased search latency troubleshooting guide
- Check Infrastructure metrics – High CPU, Memory, disk, network, and heap utilization. Frequent and long Garbage Collection(GC) on ES data nodes is a symptom and its cause needs to be identified.
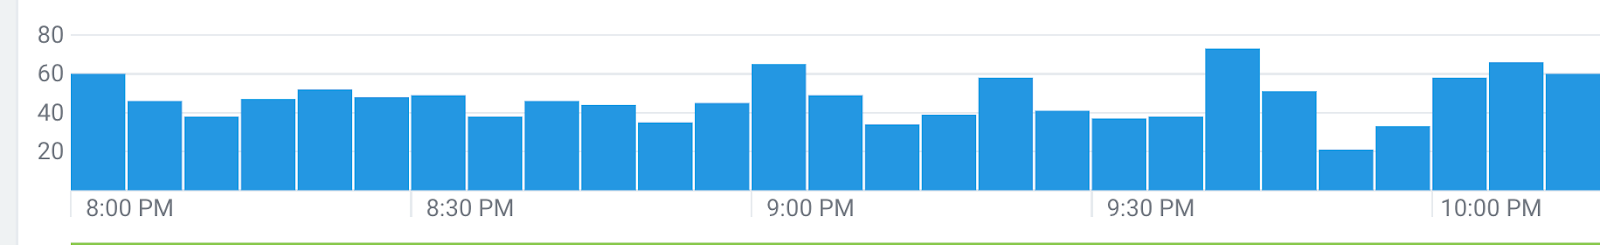
- Before checking the slow logs, it is recommended to check the ES circuit breakers stats – the estimated memory usage and how many times and when were the breakers triggered. Both of these give a good indication that searches are involved with the load and can help narrow the scope to only search slow logs. The number of search slow logs of the Elasticsearch index generally increases significantly when the response time of Elasticsearch degrades, as shown in the image below from the case study – the Y axis in the image represents the count of slow queries which took more than 100ms, and the X-axis shows the time interval.

- Check for costly queries, you can start with more than 100 ms and increase this range up to 10 seconds or more according to your application. The idea is to figure out which search queries are performing the worst. Use ES hot threads API, It helps with quickly figuring out which types of operations in ES queries are consuming the most CPU. Some well-known costly queries include heavy aggregations and regex queries.
- If a lot of slow queries are basic search queries (simple boolean match queries without aggregation), then take these sample queries and run them directly on less loaded environments like a bench or during an off-peak time on the production cluster. This way you can check the response time.
- One of the reasons for basic and historically fast search queries coming in slow logs is that when the cluster executes heavy searches and these searches consume much of the resources, then all the other searches around that time would start to run slow and would look like a slow search. For this reason, it is good practice to check the time range when the issue started and try to find the first slow searches to fast track your troubleshooting. This way you won’t have to deal with false positives.
- Another quick way to find heavy searches is to check which searches used to run fast before, and discard them – if a query is running periodically and usually executes quickly, it means this is probably not the heavy search you are looking for and these are coming in slow logs due to the ripple effect of actual heavy search queries. It’s very important to understand slow query logs in order to identify and troubleshoot ES performance issues.
Outage data
ES index configuration
- 5 Primary shards and 2 replica shards.
- Total no. of docs ~500K and total index size ~2GB.
ES cluster configuration
- 6 data nodes.
- 3 master nodes.
- More than 15 indices hosted on the cluster with 5 shards and 2 replicas for each index.
Root cause analysis for the outage case study
With the help of the above guide, the team found out these ES queries were executing to all the shards and the situation was worse than anticipated. The overall ES query was not just taking ~2 seconds, as mentioned in the slow query log of a single shard, it was actually taking a cumulative sum of over 10 seconds overall (including all shards) for a single query. Please note that these searches came from the search bar on a website. Desirable SLA for these searches was within 100 ms and these usually run within 50 ms, hence the limit configured for slow searches is 50 ms in an application and it can be changed as explained in Elasticsearch documentation.
This index had just 500K documents with an index size of 2 GB, which could fit fairly well into 1 shard. ES creates a separate thread to query each shard and there is a separate fixed-size thread pool for search queries (Elasticsearch Threadpool Explanation and Examples). Given that the ES cluster had 6 data nodes and the ES index had 5 primary shards, ES had to query all shards to get the results, which required 5 threads for each search query, resulting in the exhaustion of search threads. This caused the threads to stall in the waiting state and slowed search queries.
Troubleshooting actions to handle the outage
Simply reducing the number of primary shards for the problematic index from 5 to 1 did the trick and after that, it ran fairly smoothly even during peak traffic. ES also changed the default number of primary shards from 5 to 1 from ES 7.X. Like so many other ES deployments, the team, in this instance, ran an old ES version and used the default settings of ES. As a general rule of thumb, it is better to use single shards where possible.
Outcome of slow query logs after troubleshooting actions
Search slow logs of the same index after being fixed show few counts of slow logs(~80) compared to the few thousands(~4k) in the previous image (taken during the outage).
Important tips and takeaways to handle bursts of search traffic
- While ES has a reasonable default value for many settings for a normal deployment, you will probably need to tune it if you are using it to build high throughput and scalable systems.
- It is recommended to keep the shard sizes optimal. An optimal read-heavy shard should be somewhere between 30-50gb. In the event of many small read-only shards it is recommended to combine them into a single shard using the re-index API.
- Juggling many systems (infra monitoring, log analysis, and different dashboards) takes a toll during these outages and if you are not an ES expert, it may be difficult to troubleshoot these issues on your own. For more information on how to handle situations like these, reach out to Opster.
- Read our guide on oversharding.
- The case described above is another example where a simple settings configuration can cause a lot of trouble. To check if your ES settings are optimized according to the latest best practices please visit Opster’s ES check-up (free 2-minute process).
FAQ
Elasticsearch provides the possibility to create a log output of all search queries that take longer than a certain specified amount of time to execute. This output is called “slow logs”.
In addition to these 10 tips try reading this guide on how to improve search speed
1. Optimizing your queries
2. Avoid using scripts
3. Avoid leading wildcard queries
4. Use timeout when searching
5. Avoid complex aggregations if you don’t need them
6. Freeze unused indices
7. Increase refresh interval
8. Increase node query cache size
9. Optimize shards and replicas
10. Increase hardware resource