
Quick links:
Introduction
This article is Part III of a 3-part series on how to secure an OpenSearch cluster.
- Part I – Access Control (users, roles, permissions, etc)
- Part II – Configuration (certificates)
- Part III – Audit logs (how to create a Dashboard to visualize audit logs)
After we configured our cluster, including certificates, and defined our users and roles, the next key to reinforcing our security is auditing how users can interact with our cluster.
We want to be able to prevent a malicious user from harming our system, prevent undesired logins from flooding the cluster, and so on and so forth. To do this, we need to plan in advance by enabling audit logs. We will also review how to create a Dashboard for visualization of our audit logs.
Enabling Audit Logs
To enable audit logs, add the following line to opensearch.yml on each node:
plugins.security.audit.type: internal_opensearch
Audit events
Audit events include:
- FAILED_LOGIN: Credentials cannot be validated (e.g: incorrect password).
- AUTHENTICATED: User successfully authenticated.
- MISSING_PRIVILEGES: User does not have privileges to execute the request.
- GRANTED_PRIVILEGES: Successfully requested.
- SSL_EXCEPTION: Request without valid SSL/TLS certificate.
- opensearch_SECURITY_INDEX_ATTEMPT: Attempt to modify security plugin without permission.
- BAD_HEADERS: An attempt to spoof a request with internal security headers.
Events are recorded in two ways: rest layer and transport layer. You can see the details here.
Configuration options for audit logs
The most important configuration options for audit logs are excluding categories, disabling rest and transport layers, and disabling request body logging.
Excluding categories
You can exclude event categories from one of the layers:
plugins.security.audit.config.disabled_rest_categories: AUTHENTICATED, opensearch_SECURITY_INDEX_ATTEMPT
plugins.security.audit.config.disabled_transport_categories: GRANTED_PRIVILEGES
Disabling REST or transport layer
To entirely exclude a layer from sending logs:
plugins.security.audit.enable_rest: false
plugins.security.audit.enable_transport: false
Disabling request body logging
The body request is included in the logs by default, but you can disable it if you wish to.
plugins.security.audit.log_request_body: false
Additional configuration options:
- Disable logging all affected index names from an alias or wildcard
- Configure bulk request handling
- Exclude requests
- Exclude users from logs
- Configure audit log index name
- Tune the thread pool
For this example, we will keep all of these at their default values.
Visualization of Audit Logs
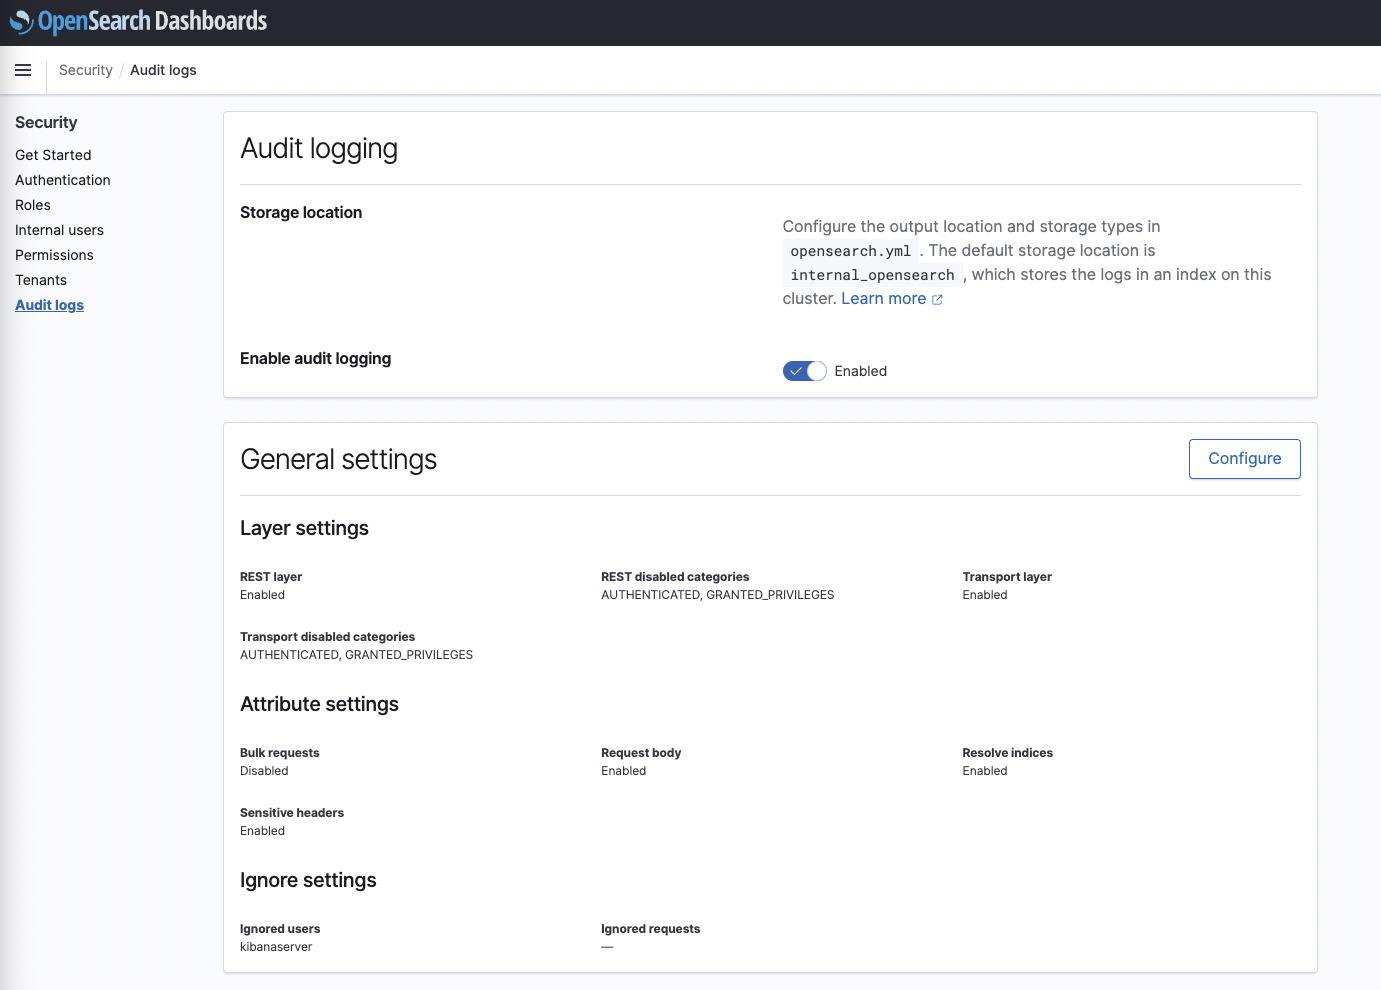
We’d like to create a Dashboard for audit logging. First, go to Security -> Audit logs to make sure everything is working correctly. The settings described above can be changed from this screen:
By default, OpenSearch ingests logs into a security-auditlog-YYYY.MM.dd index, so we need to create an index pattern to be able to visualize the data in Dashboards.
Go to Stack Management -> Index patterns -> Create.

Create a security-auditlog-* index pattern to capture all the roll over indices. Then select @timestamp as the time field. It’s also a good idea to go to “Advanced settings” and set the same pattern name to the ID. This will allow you to have a consistent ID when importing/exporting and friendlier URLs.
Now go to Discover and select the index pattern just created.

We will see some documents like this (*):
{
  "_index": "security-auditlog-2022.05.12",
    "audit_transport_request_type": "IndexRequest",
    "audit_category": "MISSING_PRIVILEGES",
    "audit_request_body": "{\n  \"customer_name\": \"Crazy Pete\"\n}\n",
    "@timestamp": "2022-05-12T17:27:58.837+00:00",
    "audit_request_remote_address": "172.18.0.2",
    "audit_request_privilege": "indices:data/write/index",
    "audit_node_host_address": "172.18.0.4",
    "audit_request_effective_user": "gpete",
    "audit_trace_indices": [
      "customer_index"
    ],
    "audit_trace_resolved_indices": [
      "customer_index"
    ],
    "audit_node_host_name": "172.18.0.4"
  },

}
So, it looks like our user “gpete” from the Happy, Inc system example from Part I is trying to run a write request when he only has permission to read.
*Some fields removed for readability, all fields and definitions can be found here.
Let’s design a classic audit logs Dashboard. It should include:
- List of user logins by user/IP
- List of failed logins user/IP
- Events per category
- Events per index
- Events per request type
- Events per path
- List of recent events
With this information you can track things like:
- Users/IPs trying to break passwords
- Users/IPs trying to execute queries without privileges
- Which queries are users running
- Events/Logins trend
- Events by category
- Events by request privilege
- Events by request type
This is the final result, and the saved object can be downloaded here.

Notes and good things to know
Showing only some fields/documents in a Dashboard doesn’t mean a user cannot see everything if they run OpenSearch queries to the cluster directly. If you want to protect certain fields or documents at a cluster level, refer to Part I of the series.
Conclusion
In a few simple steps we can set up audit logs and powerful visualizations. As important as it is to protect the cluster, it is just as important to monitor the way our users are interacting with it.
Audit logs are an amazing solution for monitoring users’ behavior in a granular way.
But what if something happens when we are not present? This is where alerts come into the picture. If something happens with any of our logged data (related to metrics, or logs like this) OpenSearch will alert you. To learn how to set up alerting in OpenSearch, check out this guide.