Summary
This article covers how to activate slow logs in Elastic Cloud and analyze the resulting logs with AutoOps Search Log Analyzer to locate the problematic query/indexing request.
The steps are as follows:
- Activate log shipping
- Open search/indexing slow logs
- Download slow logs from the elastic cloud with elasticdump
- Convert data in JSON format to log format with jq
- Upload slow logs to AutoOps Slow Log Analyzer
Activate log shipping
Log in to Elastic Cloud => Logs and Metrics => Ship to a deployment => Enable => Save.

Open search/indexing slow logs
Open search slow logs
PUT *,-.*/_settings
{
  "index.search.slowlog.threshold.query.warn": "1s",
  "index.search.slowlog.threshold.fetch.warn": "1s"
}
Note: The search slow log threshold is now set to 1 second. This means that all queries longer than 1 second will be logged. You can set the threshold value according to your needs.
Open indexing slow logs
PUT *,-.*/_settings
{
  "index.indexing.slowlog.threshold.index.warn": "1s",
  "index.indexing.slowlog.source": "10000"
}
Note: The indexing slow log threshold is now set to 1 second. This means that all indexing longer than 1 second will be logged. You can set the threshold value according to your needs.
Close indexing/search slow logs
You should leave it activated for 1 hour and then disable it.
PUT *,-.*/_settings
{
  "index.search.slowlog.threshold.query.warn": null,
  "index.search.slowlog.threshold.fetch.warn": null
  "index.indexing.slowlog.threshold.index.warn": null
}
Download slow logs from Elastic Cloud with elasticdump

You can find your cluster_id and endpoint from: <cluster_name> => Elasticsearch.
The endpoint looks like this: https://discovery1.es.us-central1.gcp.cloud.es.io.
The cluster_id looks like this: bba90499b38a4f98907ae7610dd03msb.
Note: we will use only this part of the endpoint: “.es.us-central1.gcp.cloud.es.io”.
Before running the `elasticdump` command, let’s check that we have the correct URL with the `curl` command.
curl https://elastic:<password>@bba90499b38a4f98907ae7610dd03msb.es.us-central1.gcp.cloud.es.io:9243
elasticdump --input=https://elastic:<password>@<cluster_id>.<modified_endpoint>:9243/elastic-cloud-logs-* --type=data --output=slow_logs.json --headers='{"Content-Type": "application/json"}' --sourceOnly --searchBody='{"query":{"bool":{"filter":[{"terms":{"event.dataset":["elasticsearch.slowlog"]}}]}}}'Convert data in JSON format to log format with jq.
When elasticdump finishes downloading, you should transform the .json file to a .log file. You can use the jq for this.
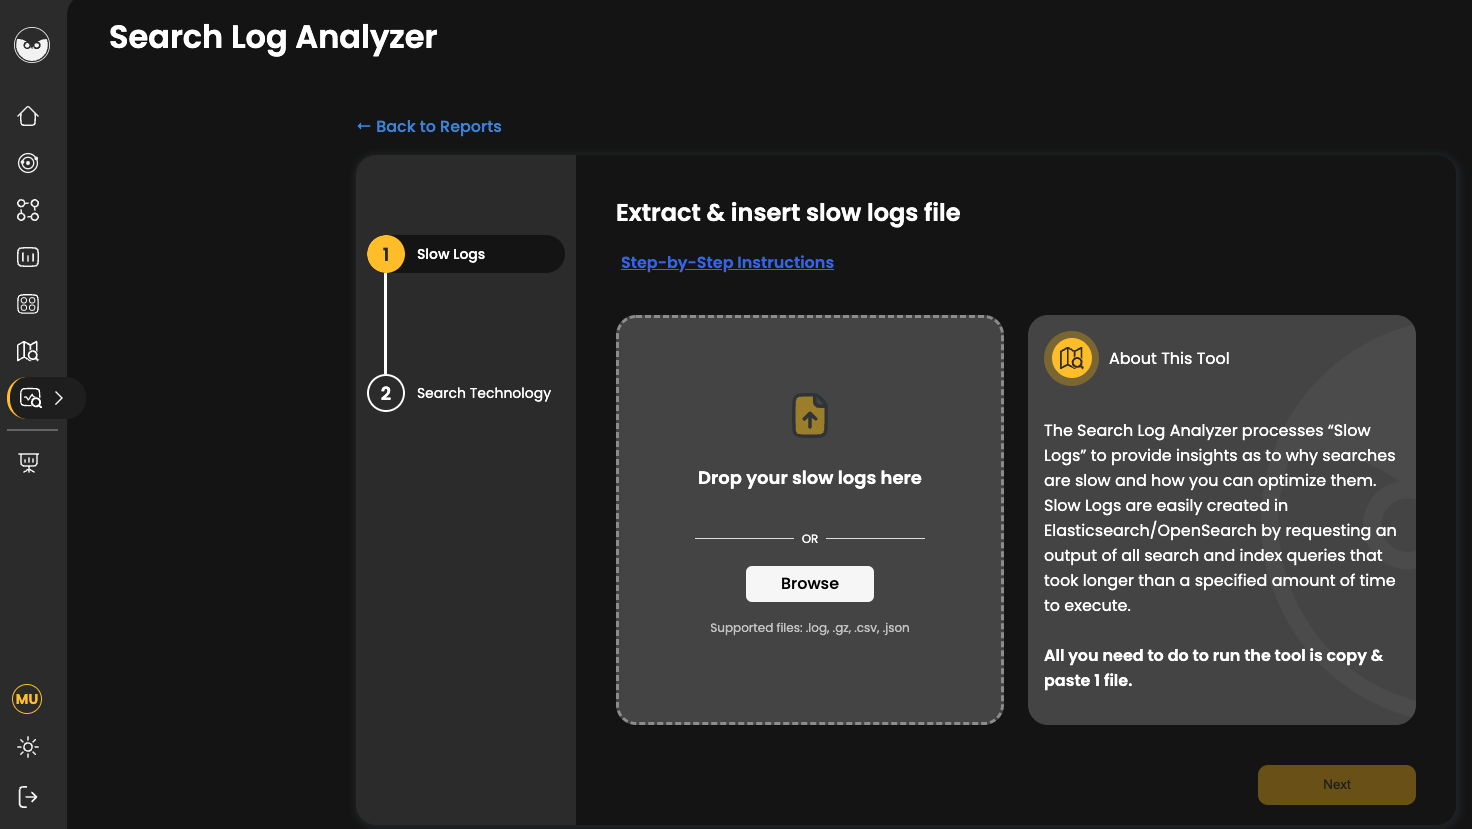
jq -c '{message}' slow_logs.json > slow_logs.logUpload to Search Log Analyzer in AutoOps
After transforming your log file, please upload it to AutoOps => Search Log Analyzer. You can investigate the slow logs by yourself or turn to your customer support representative for help.