Welcome to the Opster AutoOps installation guide.
Get started
AutoOps is a complete solution for operating and optimizing Elasticsearch. AutoOps prevents & resolves issues, cuts down administration time and reduces hardware costs. Available along with Opster’s proactive support, you no longer have to worry about your search operation – Opster takes charge of it.
You can benefit from AutoOps whether you’re running self-hosted or by Elastic Cloud
Opster AutoOps requires the installation of an Agent (Opster Metricbeat) to extract metrics for analysis. Using our guided installation process, you can choose your preferred environment to install the Metricbeat and customize the installation settings and and preferred security preferences.
Opster is SOC 2 Type II certified. No sensitive information is collected or sent to Opster’s system.
Quick links
- Installation
- Permissions
- Troubleshooting
- Upgrade to latest Opster Metricbeat version
- Uninstall Opster Metricbeat
Installation
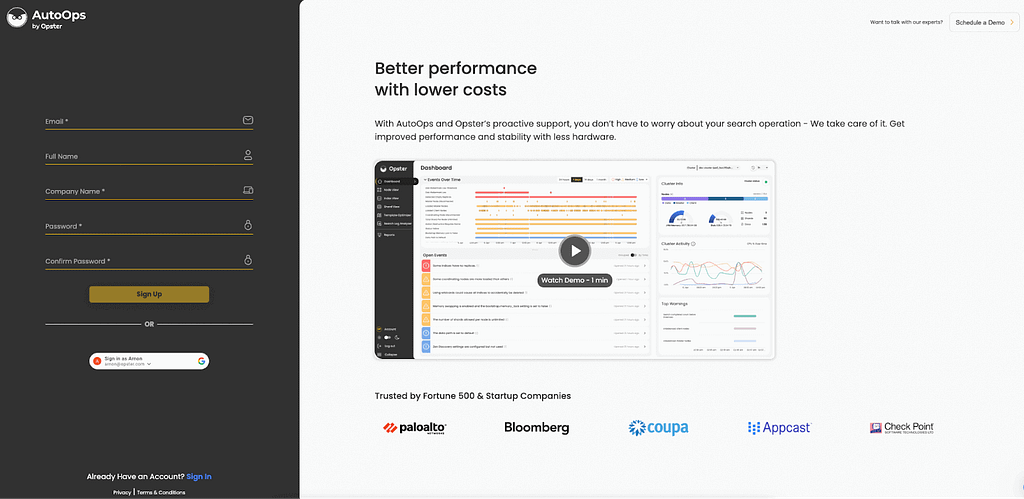
Step 1 – Sign up for AutoOps
To create an account, sign up to AutoOps with your email address or SSO using your Google account. Once registered, follow the steps in our guided installation process. The installation should take about 3-5 minutes to complete.
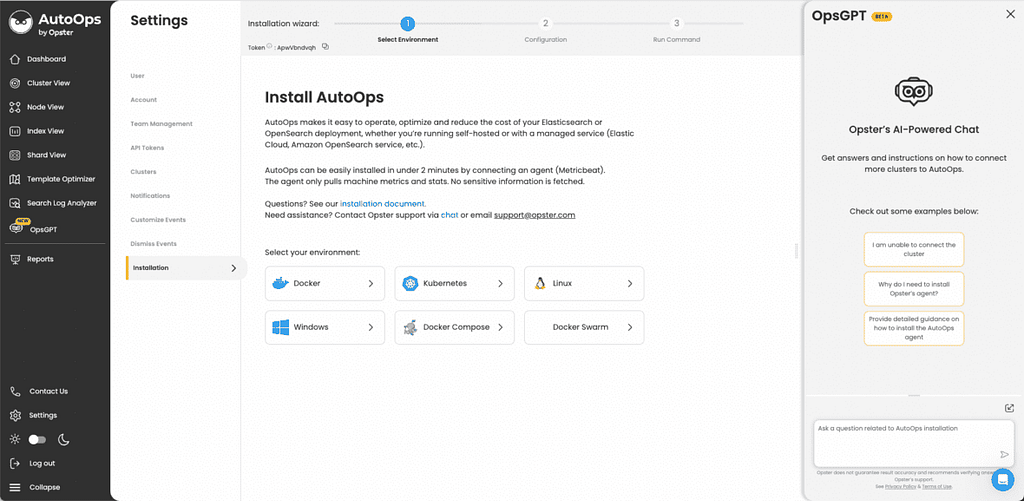
Step 2 – Select the environment to install Opster Metricbeat
Choose the environment on which to install Opster Metricbeat from the list below:
- Docker
- Kubernetes
- Linux
- Docker Swarm
- Docker Compose
- Windows
Tip:
As Opster Metricbeat continuously sends cluster metrics for analysis, we don’t recommend installing it on a personal computer that may shutdown/sleep. It’s also not recommended to install it on cluster nodes’ VM, because the cluster might scale down or nodes may be replaced and lose the agent.
Step 3 – Customize Metricbeat settings
AutoOps will create the installation based on the selected environment and the selected configuration. In this step you will need to provide the information listed below:
Please note: Some of the parameters will be set automatically in the command, like a unique Opster Token.
| Parameter | Explanation | Command parameter |
|---|---|---|
| Elasticsearch / OpenSearch Server URL and port | The URL should point to the location of the Elasticsearch / OpenSearch cluster host for the agent to connect and pull the metrics. The server URL can include the port number, but it is not mandatory. - http://cluster01.internal:9200- https://cluster.cloud.es.io- https://localhost:9200 Each cluster should be connected to a dedicated Opster Metricbeat agent. | ES_URL |
| Opster token (AutoOps auto settings) | Opster token is a unique ID created to identify the information in AutoOps. This number shouldn’t be shared.The token ID will be automatically included in the command. | OPSTER_TOKEN |
| Opster port | Select a port from the list to be used when sending the data to AutoOps. - Port 80: Works without encryption. - Port 443: Works with SSL encryption key. - Port 5044: Used in past installations (Not recommended). | OPSTER_PORT |
| Opster host (AutoOps auto settings) | AutoOps destination endpoint - receiver.opster.io - Default settings - rcvs.opster.io - Encrypted with SSL | OPSTER_HOST |
| Authentication method | Select one of the authorization settings: - None: [Default settings] no credentials are required to connect. - Basic authorization: Provide user and password. - AWS IAM: For advanced AWS settings, provide the following credentials: 1) Access Key ID 2) Secret Access Key 3) AWS Region | |
| System architecture | Select the host system architecture: - X86_64 - AArch64 |
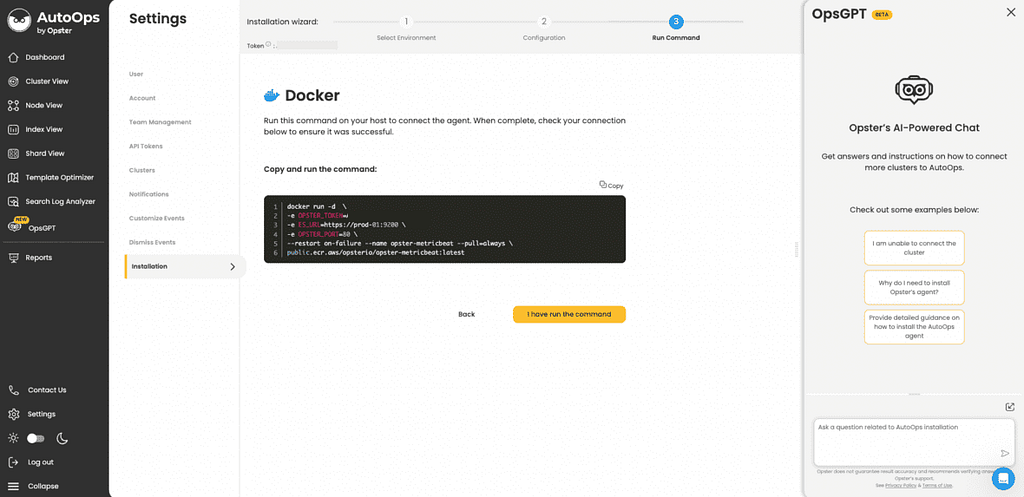
Step 4 – Run the installation command
Based on the previous steps, AutoOps will generate a command with the selected settings. There is no need to manually change the command.
- Copy the command and run it in the selected environment
Tip: It can take a few minutes for the metrics to arrive. - Return to AutoOps and press the “I have run the command” button. Once the metrics reach the system, a message will appear on screen showing the analysis progress.
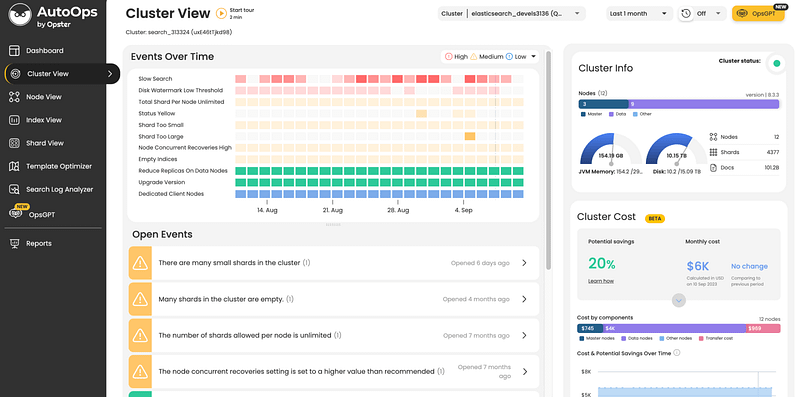
- Once the initial analysis is complete, you will be directed to the AutoOps dashboard to review the results.
Additional settings
Permissions
If your cluster is run by a managed service, you may have to add additional permissions to allow the extraction of the needed stats.
Elasticsearch:
- Cluster privileges: monitor, monitor_ilm, monitor_snapshot
- Index privileges:
- Indices: *
- Privileges: monitor
OpenSearch:
- Cluster level permission: cluster_monitor, manage_snapshots
- Index level permission: indices_all
Firewall settings
If you’re required to open an IP/port on your firewall to ship the data, please add the following:
- Address:
- 100.24.140.28 – receiver.opster.io
- 3.230.83.185 – rcvs.opster.io
- Port: 80, 443 or 5044 (less recommended)
Upgrade to latest Opster Metricbeat version
When it is time to upgrade to a newer Metricbeat version, use the command below to uninstall the existing Metricbeat agent and install the latest version.
Docker
sudo curl -LS https://opster-metricbeat-upgrade.s3.amazonaws.com/docker.sh | bash
Kubernetes
sudo curl -LS https://opster-metricbeat-upgrade.s3.amazonaws.com/k8s.sh | bash
Helm
sudo curl -LS https://opster-metricbeat-upgrade.s3.amazonaws.com/docker.sh | bash
Rpm
sudo curl -LS https://opster-metricbeat-upgrade.s3.amazonaws.com/linux_rpm.sh | bash
Deb
sudo curl -LS https://opster-metricbeat-upgrade.s3.amazonaws.com/linux_deb.sh | bash
Docker Swarm
sudo curl -LS https://opster-metricbeat-upgrade.s3.amazonaws.com/docker_swarm.sh | bash
Docker Compose
sudo curl -LS https://opster-metricbeat-upgrade.s3.amazonaws.com/docker_compose.sh | bash
Windows
Open PowerShell as administrator
wget https://opster-metricbeat-upgrade.s3.amazonaws.com/windows.ps1 ; .\windows.ps1
Uninstall Opster Metricbeat
Made the decision to remove Opster’s Metricbeat agent from your machine. Follow the command to uninstall the Metricbeat.
Rpm
sudo dnf remove metricbeat-opster
Deb
sudo dpkg -r metricbeat-opster
Docker
a. List the containers running in the environment
docker ps
b. delete agent
docker rm --force <CONTAINER_ID>
Docker compose
docker-compose down
Docker swarm
a. List the containers running in the environment
docker ps
b. Delete agent
docker rm --force <CONTAINER_ID>
Helm
a. Check metricbeat release name
helm ls
b. Delete agent
helm uninstall <release_name>
K8s
a. Check that metricbeat deployment exist on namespace
kubectl get deployments
b. Delete agent
kubectl delete deployment <deployment_name>
Windows
a. Run powershell as administrator
b. Delete and stop the service
if (Get-Service metricbeat -ErrorAction SilentlyContinue) {
  $service = Get-WmiObject -Class Win32_Service -Filter "name='metricbeat'"
  $service.StopService()
  Start-Sleep -s 1
  $service.delete()
}